by Kenneth J. Retzl
Our research team often receives questions regarding the graduation rates of schools, districts, and the State of Nevada. A previous blog discussed the potential cause of the recent increase in graduation rates observed in several Nevada school districts. However, a recent discovery left us puzzled. The Clark County School District (CCSD) and Washoe County School District (WCSD) make up a significant portion of the public school enrollment in Nevada (approximately 80 percent according to the Nevada Report Card). The most recent graduation data available for the class of 2017 reports CCSD’s graduation rate is 83.2 percent and WCSD’s rate is 84.0 percent. However, the overall graduation rate for Nevada is only 80.9 percent. This conundrum (how can the two districts that comprise approximately 80 percent of the State’s student enrollment have a graduation rate that is several percentage points higher than the State of Nevada average) led to this blog post.
For those who want a short answer without walking through the technical process: Nevada’s overall graduation rate includes groups of schools that are not included in any district’s graduation rate (primarily District-Sponsored Charter Schools and behavior schools). However, some districts are including behavior schools in their graduation rate calculation, suggesting there are potential inconsistencies across districts.
The longer answer illustrates the importance of understanding what numbers/groups are included in an aggregation (often called “the business rules”) to ensure appropriate comparisons.
The Problem
As discussed above, there is a seeming contradiction in the graduation numbers in Nevada. The State graduation rate is 80.9 percent, but the two largest districts (comprising approximately 80 percent of the total student population) have graduation rates 2 to 3 percent higher. Table 1 displays the most recent available graduation data for the class of 2016-2017.
Table 1 – 2016-2017 Graduation Rates
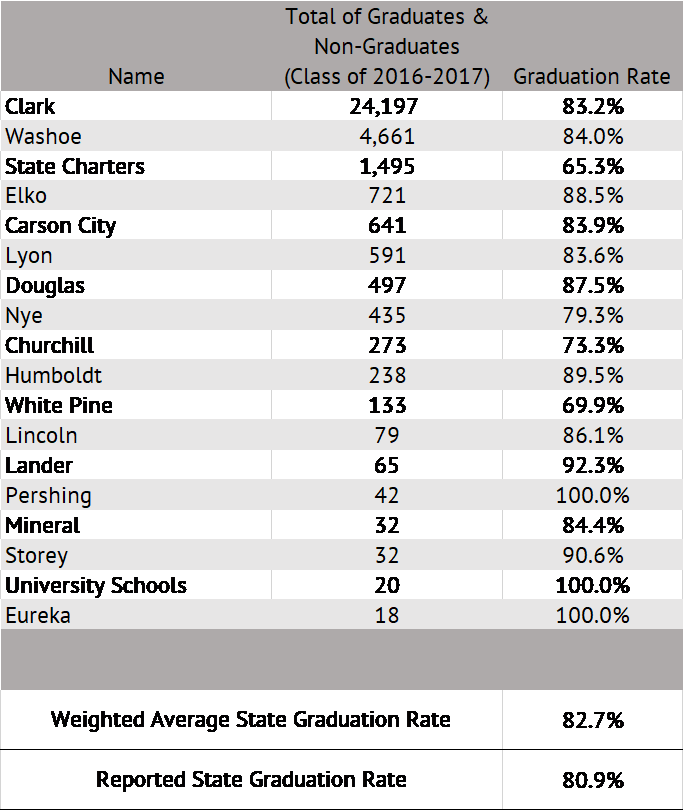
Based on the total number of eligible graduates, it is possible to create a weighted average graduation rate for the State. To do so, one sums the total number of graduates and non-graduates in a district and divides by the total number of graduates and non-graduates in the State. This provides the proportion of the State’s seniors enrolled in each district. The proportion for each district can then be multiplied by the respective district’s graduation rate to obtain the contribution to the overall State rate. Once this is done for every district, simply sum all the district calculations. Based on this methodology, the weighted average graduation rate for the State is 82.7 percent. This will never be a perfect match to the actual graduation rate, but it should provide an approximation of the graduation rate. However, when compared to the actual graduation rate reported by the State, at 80.9 percent, the weighted average is approximately 2 percent higher. This discrepancy suggests something could be occurring that is causing the large difference, which will be explored further in the remainder of the post.
Unfortunately, a search for a Nevada Department of Education guidance document to explain how school districts calculate their graduation rates was not found. Because of this, the data presented below are the best approximations of what is (and is not) being included in the graduation rate calculations. Adding to the difficulty of the analysis, Nevada suppresses data if there are 10 or less individuals in a select population. This means that very small schools that might have graduates are not included in the publicly available data. This increases the difficulty in determining exactly which schools are, or are not, included in graduation calculations.
District Graduation Rates
We will start with a simple example to illustrate just how difficult calculating graduation rates can be. Table 2 presents the graduation data for all high schools in the Lincoln County School District (LCSD) that was obtained from the Nevada Report Card.
Table 2 – Lincoln County School District
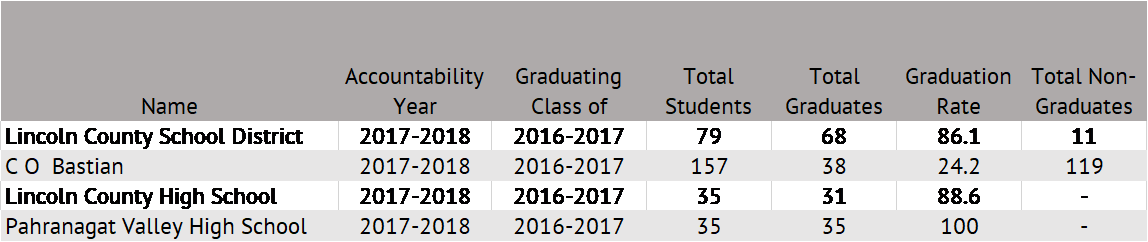
We would expect that when adding up the columns “Total Students,” “Total Graduates,” and “Total Non-Graduates” for the 3 individual schools within the Lincoln County School District (C O Bastian, Lincoln County High School, and Pahranagat Valley High School), each column would total the “Lincoln County School District” totals (seen in Table 2 on line 1). However, it is clear this is not occurring. It appears C O Bastian is not included. However, even with that distinction made, there are still several other problems:
- If the “Total Students” column is summed for Lincoln County and Pahranagat Valley High Schools, the total is 70 students. The LCSD aggregation reports 79. Similar discrepancies can be found in the “Total Graduates” and “Total Non-Graduates” columns.
- The suppression rules are oddly applied. The “Total Non-Graduates” for both Lincoln County and Pahranagat Valley High Schools are seemingly suppressed; however, it is unknown why only that number is being suppressed. Simple subtraction suggests there were 4 and 0 non-graduates at Lincoln County and Pahranagat Valley High Schools, respectively.
Our assumption is that within the LCSD, only the Lincoln County and Pahranagat Valley High Schools are included in the District’s graduation rate (but there are still nine unaccounted for students). Upon further investigation, the C O Bastian High School is also known as the Caliente Youth Center, and is dedicated to supporting the educational needs of “youth committed to the State for correctional care.”
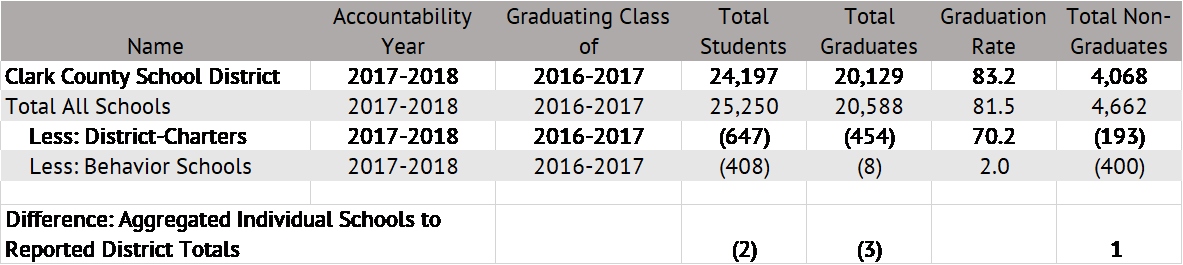
A similar pattern emerges in Table 3, displaying comparable data for CCSD. In the interest of space, we summed the “Total Students,” “Total Graduates,” and “Total Non-Graduates” for all schools reported within CCSD on the Nevada Report Card. We also calculated the graduation rate for all these schools and reported these numbers on the “Total All Schools” row. As is evident, this aggregation does not agree with the CCSD reported numbers. It appears as if the district rate reported by CCSD does not include District-Sponsored Charter Schools or behavior schools.[i] Removing district-sponsored charters (with a graduation rate of 70.2 percent) and behavior schools (2.0 percent graduation rate) increases the officially reported CCSD rate (from 81.5 percent to 83.2 percent).
Table 3 – Clark County School District
We do not intend to imply that what CCSD is doing is inappropriate. We are simply attempting to recalculate the graduation rates beginning with individual schools, then using the school data to recalculate school district percentages, and finally, the State of Nevada’s graduation rate. From both the CCSD and LCSD data, it is clear that this is not possible without knowing certain rules in what schools to include/exclude in the district graduation rates. The real problem is that we do not know the rules that districts are supposed to follow to calculate their graduation rates.
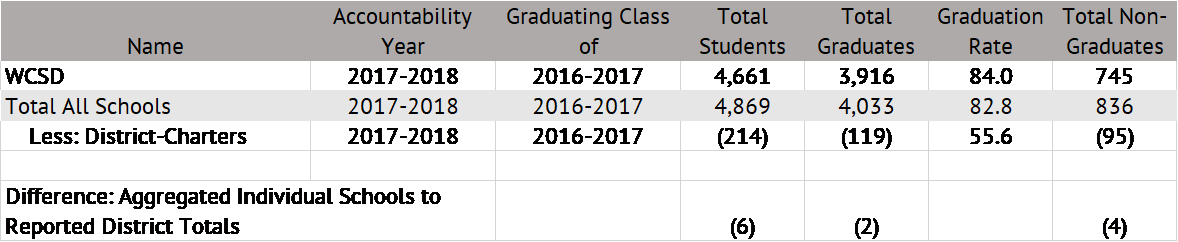
Similar to CCSD, the Washoe County School District excludes its District-Sponsored Charter Schools when calculating the graduation rate (see Table 4).
Table 4 – Washoe County School District
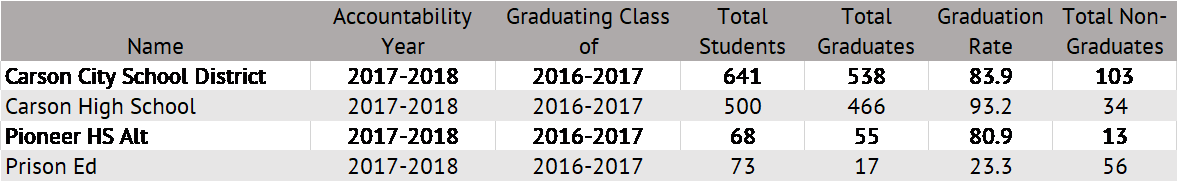
Interestingly, the Carson City School District includes all its schools, including a potential behavior school called “Prison Ed” (see Table 5). Remember, the Clark County and Lincoln County School Districts remove their behavior schools from the official graduation rates. This suggests a potential inconsistency in the way the Carson City School District handles behavior schools, as compared with other districts.
Table 5 – Carson City School District
Aside from the four districts displayed above, the only other district aggregation we do not understand are the State-Sponsored Charter Schools. In this case, at the district-aggregated level, it reports 338 more “Total Students” than are reported by the individual schools. We are not sure what is occurring here (i.e. how the district can report substantially more students than the individual schools have enrolled).
To conclude this section, which was admittedly heavy on charts and numbers, a summary of our findings is appropriate. However, it may be better to think of these as assumptions since we were unable to find the actual business rules to calculate district-wide graduation rates.
- Suppression rules on public data make exact aggregation of graduation numbers virtually impossible.
- District-Sponsored Charter Schools are not included in the graduation rate in the school district in which they are geographically located.
- For many districts, behavior schools are excluded, but this does not appear to be consistent across all districts.
- The State-Sponsored Charter Schools district-wide aggregation includes more students than the individual schools listed.
State Graduation Rate
With the difficulty in calculating district-wide graduation rates from individual schools, it is no surprise that the calculation of the overall state graduation rate is also puzzling. Table 6 displays the aggregated numbers for each school district, as well as the overall State of Nevada graduation numbers.
Table 6 – Statewide Graduation Calculation
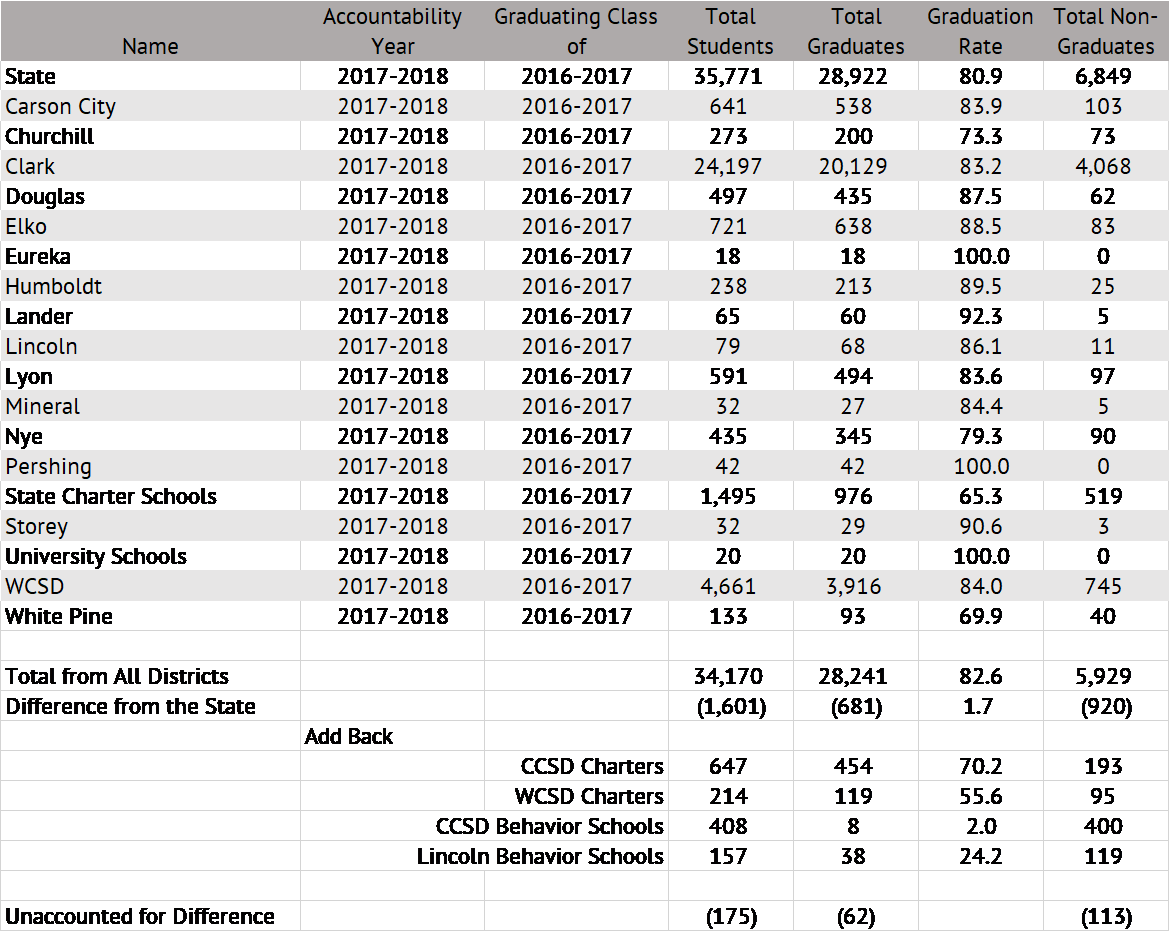
What appears to be happening in the State aggregation is those schools that were removed from the district aggregations are added back in at the State-level. This is interesting, as the underlying assumption seems to be that individual districts should not be accountable for certain schools located within their geographic boundaries (and, perhaps more importantly, within their authority), but the State of Nevada should be. At the aggregate level, these schools’ graduation rates are below their respective district’s rate. Ultimately, this results in boosting district graduation rates but reduces the State of Nevada rate.
What is also interesting is the accounted for difference of 175 students between the total students reported by the State of Nevada compared to the reconciled district totals. It is unclear if this is due to suppression rules for several schools or if there is another grouping of schools that was missed in the analysis. In completing this post, each district’s data was downloaded, and no other discrepancies were noted in aggregating to the district-level.
The other question we believed important to research is whether the exclusion of certain schools at the district-level is a recent occurrence? Based on historical State data, CCSD and WCSD have reported graduation rates higher than the State going back to at least the 2013-2014 school year. CCSD graduation rates were 74.9, 72.1, and 70.9 percent for the classes of 2016, 2015, and 2014, respectively. Similarly, WCSD reported graduation rates of 76.6, 75.0, and 72.7 percent for the same years. These rates are higher than the State of Nevada graduation rates for the same period, which were 73.6, 70.8, and 70.0 percent. While this does not rule out inconsistency over years, it does suggest CCSD and WCSD excluded students that were then included in the State graduation rate (similar to what was discussed previously).
Conclusion
Prior to completing this post, we believed that obtaining a district graduation rate would be as easy as aggregating the data for all the individual schools within that district. Similarly, the State of Nevada graduation numbers would be an aggregation of all the districts’ data. However, what we found is that districts include and exclude certain schools in calculating their graduation rate (specifically district-sponsored charters and behavior schools). These schools are then included back in the State of Nevada rate. Because of the exclusion of these schools at the district-level and then inclusion of those same schools at the State-level, the State graduation rate can seemingly defy the laws of statistics (until, of course, these business rules are understood). It is worth reiterating, we are not suggesting any of the reporting inconsistencies are intentional. However, we believe a more transparent explanation of the business rules surrounding district and State aggregations of graduation rates is appropriate.
[i] We included the following in the behavior school classification: Clark County Detention, Cowan Behavior, High Desert, Juvenile Detention, Peterson Behavioral, South Continuation, Spring Mountain, and Summit View.