by Meredith A. Levine
[For a PDF of this blog, click here]
The Supplemental Nutrition Assistance Program (SNAP), a federal program, provides nutrition benefits to supplement the food budget of low-income families and individuals. The Federal government funds the program but shares the costs of operating the program with each state. Recently, the U.S. Department of Agriculture proposed to change existing federal rules to tighten eligibility requirements for receipt of SNAP benefits, thereby either delaying or discontinuing the ability of low-income Nevadans to receive these benefits. Here we provide a brief summary of Nevadans who depend on SNAP benefits.
Data obtained from the American Community Survey shows that, of the 1.1 million households in Nevada in 2017, 129,078 received SNAP benefits. That translates into more than one in ten households, or 12.3 percent. The percentage of Nevada’s households that were SNAP beneficiaries in 2017 was just below the U.S. average of 12.6 percent, for a ranking of 29th in the nation. The average SNAP recipient received about $127 a month (or about $4.17 a day, $1.39 per meal) in Fiscal Year 2018.
As Figure 1 indicates, Nevadans’ enrollment in the program benefits increased sharply through the Great Recession and into Recovery. In 2007, prior to the Great Recession, 37,815 (or 4.0 percent) of Nevada’s households received SNAP. That number climbed to 97,141 households (or 9.8 percent) in 2010. As Recovery took hold, the number of SNAP-recipient households continued to grow, reaching 126,482 (12.6 percent) in 2012. The number of households in Nevada that received SNAP peaked in 2016, at 138,304 (13.1 percent). Despite the decline in 2017, the number of SNAP beneficiaries has not returned to pre-Recession levels. In fact, households receiving SNAP increased by 252.1 percent between 2007 and 2017.
Figure 1. Households in Nevada That Received Food Stamps/SNAP in Past 12 Months, 2005–2017
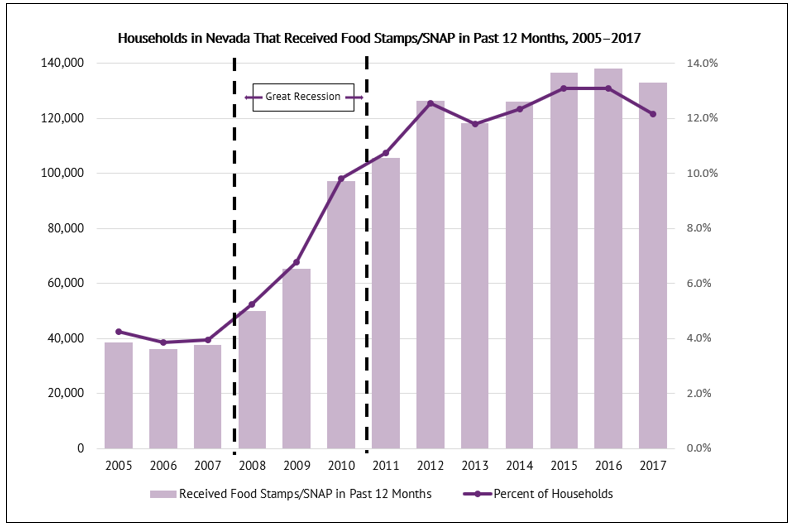
Source: ACS (Table C22001; 2005-2017). Note: SNAP formerly was known as the Food Stamp Program but was renamed in 2008.
Figure 2 maps percentage of SNAP-recipient households at the county level. The most deeply shaded counties are those with shares of households receiving SNAP that exceed the statewide average of 12.3 percent in 2017. Mineral County has the highest percentage of SNAP recipients at 18.1 percent, followed by Nye County (14.9 percent), Lyon County (13.8 percent), Carson City (13.5 percent), and Clark County (13.0 percent). Roughly 5,816 households in Mineral County, Nye County, and Lyon County, collectively, were SNAP beneficiaries in 2017, versus the 100,282 households in Carson City and Clark County.
The 97,300 households receiving SNAP in Clark County make up three-quarters (75.4 percent) of all recipient households. Using the state standard classification of urban counties (Carson City, Clark County, and Washoe County) versus rural/frontier counties (the other 14 counties in Nevada), we find that there are 117,968 SNAP-recipient households in urban counties (91.4 percent of all state households receiving SNAP; and 12.5 percent of all urban households), and 11,110 SNAP-recipient households in the latter (8.6 percent of all state households receiving SNAP; and 10.4 percent of all rural/frontier households).
Figure 2. Percent of Households Receiving SNAP, by County, 2017
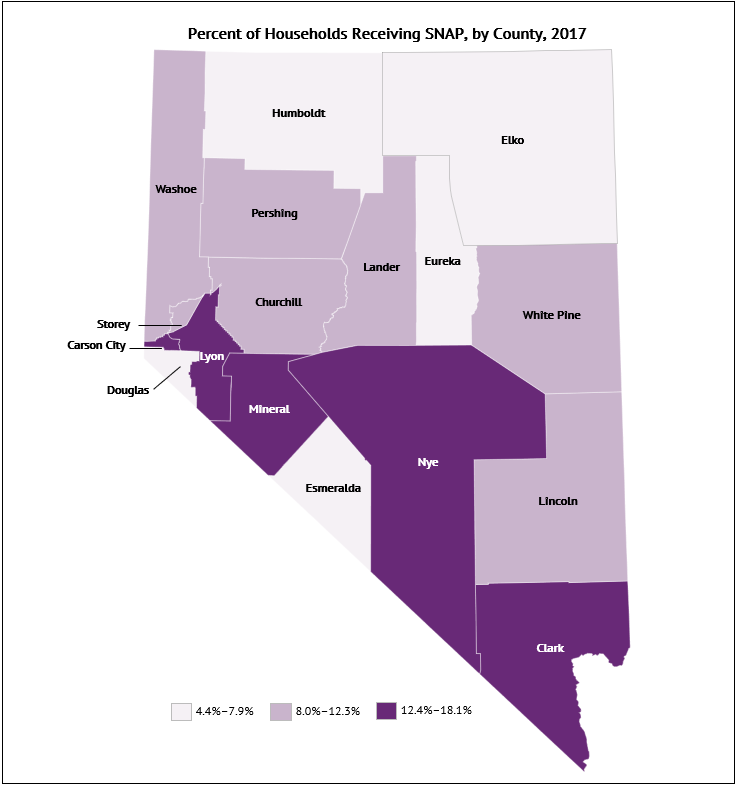
Source: American Community Survey (Table S2201)
Figure 3 indicates that households in Nevada with children make up the majority of SNAP beneficiaries. The share of SNAP-recipient households with children under 18 years decreased between 2010 and 2017, from 57.6 percent to 51.3 percent.
The number of households with children receiving SNAP grew from 33,475 in 2010 to 66,233 in 2017, reflecting an increase of 97.9 percent. SNAP-recipient households without children increased by 155.2 percent from 24,624 households to 62,845 households.
Figure 3. Percentage of SNAP-Recipient Households in Nevada, by Presence of Children, 2010–2017
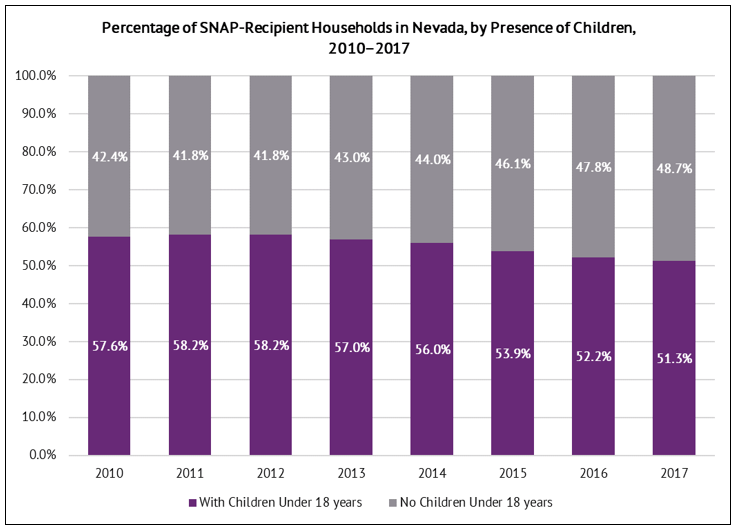
Source: American Community Survey (Table B22002; 2010-2017)
While households with children decreased as a percent of SNAP-recipient households between 2010 and 2017, those with one or more people aged 60 years and over increased slightly, from 27.0 percent to 30.1 percent (Figure 4). However, as of 2017, more than two-thirds of households receiving SNAP (69.9 percent) were comprised of persons younger than 60 years of age.
Figure 4. Percentage of SNAP-Recipient Households in Nevada, by Presence of People 60 Years and Over, 2010–2017
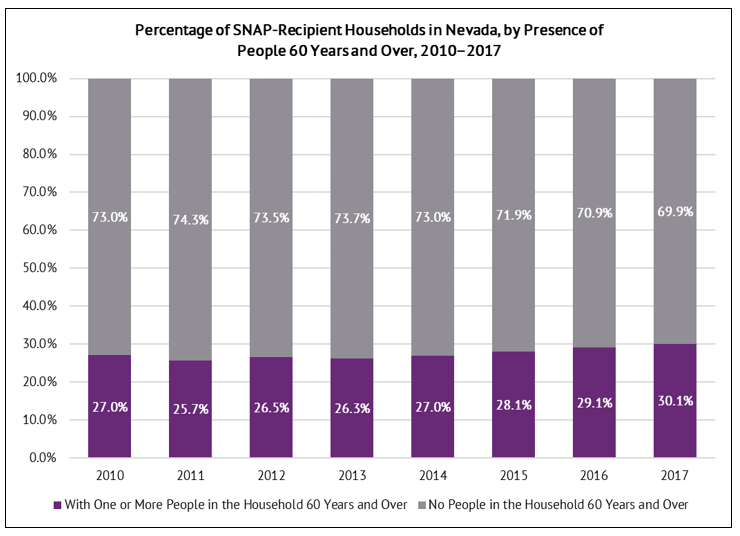
Source: American Community Survey (Table B22001; 2010-2017)
As Figure 5 illustrates, the share of households receiving SNAP that are comprised of at least one person with a disability has remained relatively constant over time at around 40-45 percent. In 2012, the number of households receiving SNAP that one or more persons with a disability was 37,608, and by 2017, that number had grown to 56,388, for a 49.9 percent increase. For SNAP households that had no persons with a disability, the number rose from 52,017 in 2012 to 72,690 in 2017, which is a 39.7 percent increase.
Figure 5. Percentage of SNAP-Recipient Households in Nevada, by Disability Status, 2012–2017
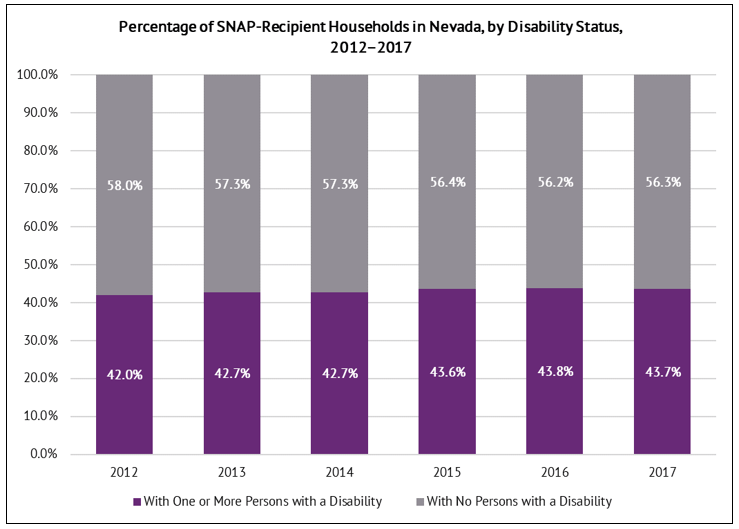
Source: American Community Survey (Table B22010; 2012-2017)
White households, African American households, and other race households comprise the largest shares of those receiving SNAP (Figure 6). White households declined as a share of those receiving SNAP from 64.1 percent in 2010 to 58.2 percent in 2017, while number of white households grew from 37,260 in the first year to 75,156 in the last year (a 101.7 percent increase). Of those receiving SNAP in 2010, 11,555 were African American households; by 2017, 24,303 African American households were SNAP beneficiaries (an increase of 110.3 percent). Other race households represented 6.0 percent of all SNAP households in 2010 (3,490 households) but increased to 15,689 households in 2017, or 12.2 percent of all SNAP households for that year; this amounts to a 349.5 percent increase over that time frame.
Figure 6. Percentage of SNAP-Recipient Households in Nevada, by Race, 2010–2017
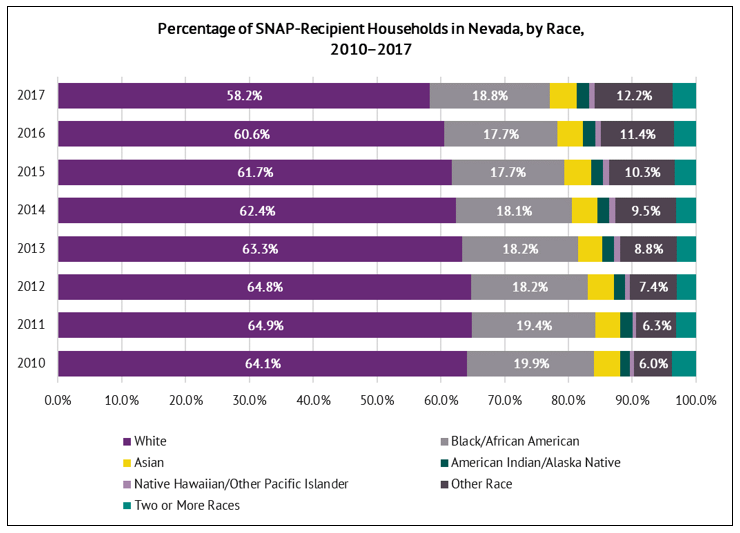
Source: American Community Survey (Tables B22005A-G; 2010-2017)
Between 2010 and 2017, the Latino share of all households receiving SNAP increased gradually—by roughly 6.6 percentage points—whereas white alone (not Latino) households decreased in kind (Figure 7). In 2010, Latino households made up 36.0 percent of all SNAP-recipient households, and white households comprised 64.0 percent of the same. By 2017, white households as a percentage of those receiving SNAP decreased to 57.4 percent, while Latino households increased to 42.6 percent of SNAP households in Nevada. About 26,694 Latino households were SNAP beneficiaries in 2010, and 53,553 Latino households were receiving SNAP by 2017, which reflects an increase of 165.2 percent.
Figure 7. Percentage of SNAP-Recipient Households in Nevada, by Ethnicity, 2010–2017
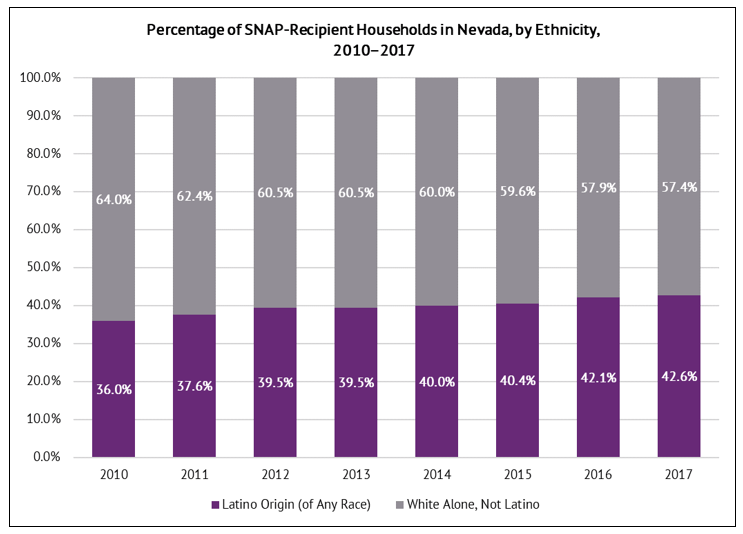
Source: American Community Survey (Tables B22005H and B22005I; 2010-2017)
While SNAP serves low-income populations, the program benefits are not limited to those who do not work. Workers may participate in SNAP temporarily, “often while between jobs or when their work hours are cut.” Other workers, “with steady, but low-paying, jobs, or those unable to work,” may participate in SNAP on a longer term basis. In fact, as Figure 8 shows, fewer than one in five Nevada households that receive SNAP are those with no workers. The graph suggests that working households form a considerable share of SNAP beneficiaries. Although the number of households in each group increased over time, working households have comprised about 80.0 percent of all Nevada households receiving SNAP benefits in any given year.
Figure 8. Percentage of SNAP-Recipient Households in Nevada, by Work Status, 2010–2017
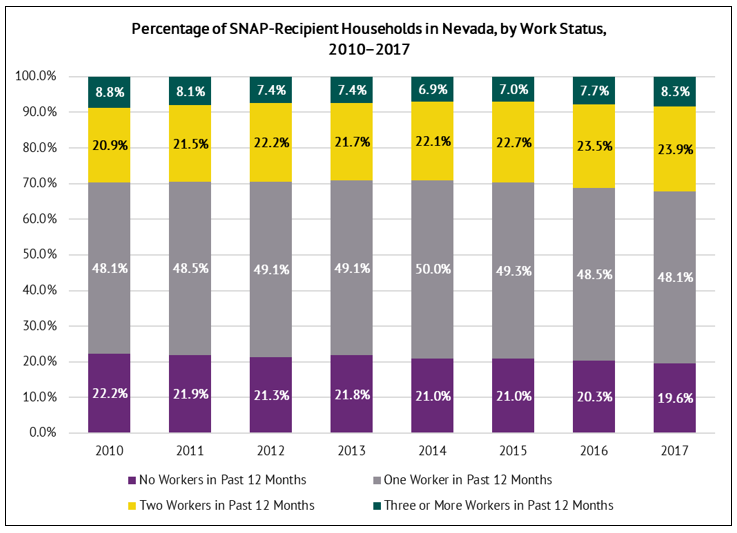
Source: American Community Survey (2010-2017)
Nevada households below the poverty level accounted for 50.0 percent of all SNAP-recipient households in 2010 but declined by 6.3 percentage points to 43.7 percent of those receiving SNAP by 2017. Households at or above the poverty level made up 50.0 percent of SNAP beneficiaries in 2010, as well, but constituted more than half of all SNAP-recipient households in 2017 (56.3 percent), as displayed in Figure 9. The number of households below the poverty level receiving SNAP in Nevada grew from 29,070 in 2010 to 56,393 in 2017, for a 94.0 percent increase. However, it is those households that were at or above the poverty level that experienced the more substantial increase of 150.4 percent between 2010 and 2017, from 29,029 households in the first year to 72,685 households in the last year.
Figure 9. Percentage of SNAP-Recipient Households in Nevada, by Poverty Status, 2010–2017
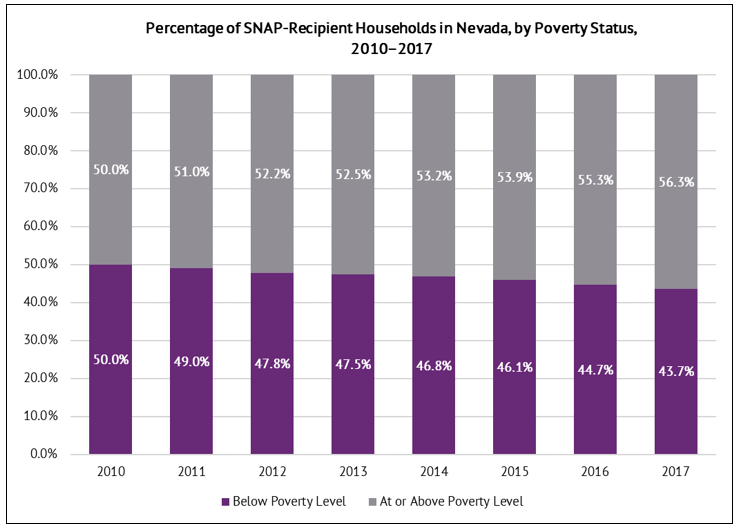
Source: American Community Survey (Table B22003; 2010-2017)
Figure 10 compares median income for SNAP-recipient households in Nevada with state median household income in inflation-adjusted dollars. In 2010, there was a gap between the two, though this narrowed in each year through 2015 before widening again in both 2016 and 2017. The median income of those households receiving SNAP was $22,147 in 2010 and $24,338 in 2017, which reflects a slight increase. On the other hand, state median household income fell somewhat precipitously, from $62,642 in 2010 to $55,434 in 2017. The near constancy of median household income amongst SNAP households versus the decline in state median household income has contributed to the convergence over time.
Figure 10. Median Household Income, 2010-2017 (in 2017 Dollars)
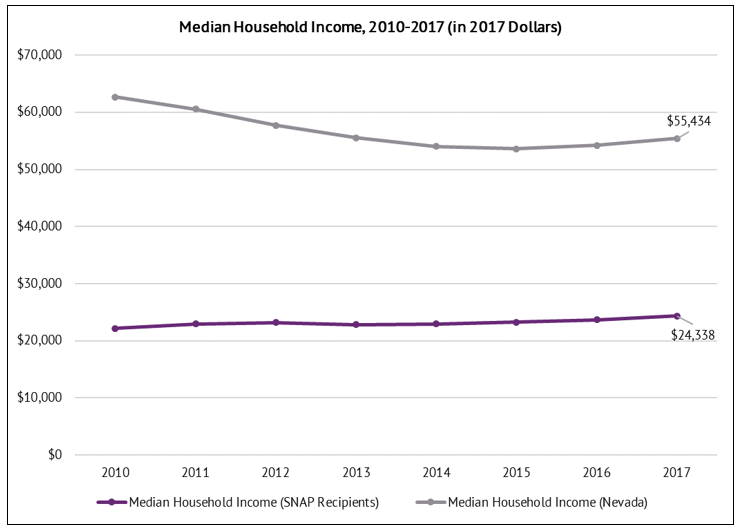
Source: American Community Survey (B22008) and U.S. Bureau of Labor Statistics (Consumer Price Index for inflation adjustment)