By Paulina Kerrigan
Earlier this month, the Clark County School District (CCSD) announced that it had enacted budget cuts amounting to approximately $68 million from its 2018-2019 general operating fund. To submit a balanced budget, district schools were asked to cut $47 million from their individual budgets, and the central administration indicated it would decrease its budget by $21 million.
The $47 million in cuts were distributed as follows: $17.6 million at high schools, $10.7 million at middle schools, and $18.8 million at elementary schools. At the school sites, this amounted to $132 per student cut in elementary schools, $153 per student cut in middle schools, and $184 in high schools (see Table 1). On average, each elementary school had to sustain $83,071 in cuts; the figure was $186,138 at each middle school, and $394,027 at each high school. (See here for an individual list of schools and their cuts and staffing reductions.)
Table 1. Distribution of Budget Cuts, By Type of School

While CCSD reported the total cuts, the Guinn Center looked the impact of the budget cuts on each school’s strategic budgets. (Here we note that strategic budgets were not publicly available for 75 schools (22 percent) so the following tables do not include information from those schools). As Table 1 indicates, high schools took the biggest hit (with cuts amounting to $184 per student). On average, this cut accounts for 4.18 percent of each high school’s strategic budget.
The CCSD budget crisis translated into significant staffing cuts at the district’s secondary schools. Table 2 presents data on the number of positions reduced districtwide.
Table 2. Number of Positions Reduced District-wide

On average, each high school cut three licensed staff members, and almost half of all high schools eliminated at least one support staff position. Shadow Ridge and Centennial High Schools each cut 8 staff positions, while Sunrise Mountain, Desert Pines, and two rural high schools – Indian Springs, and Virgin Valley – did not cut any staff positions.
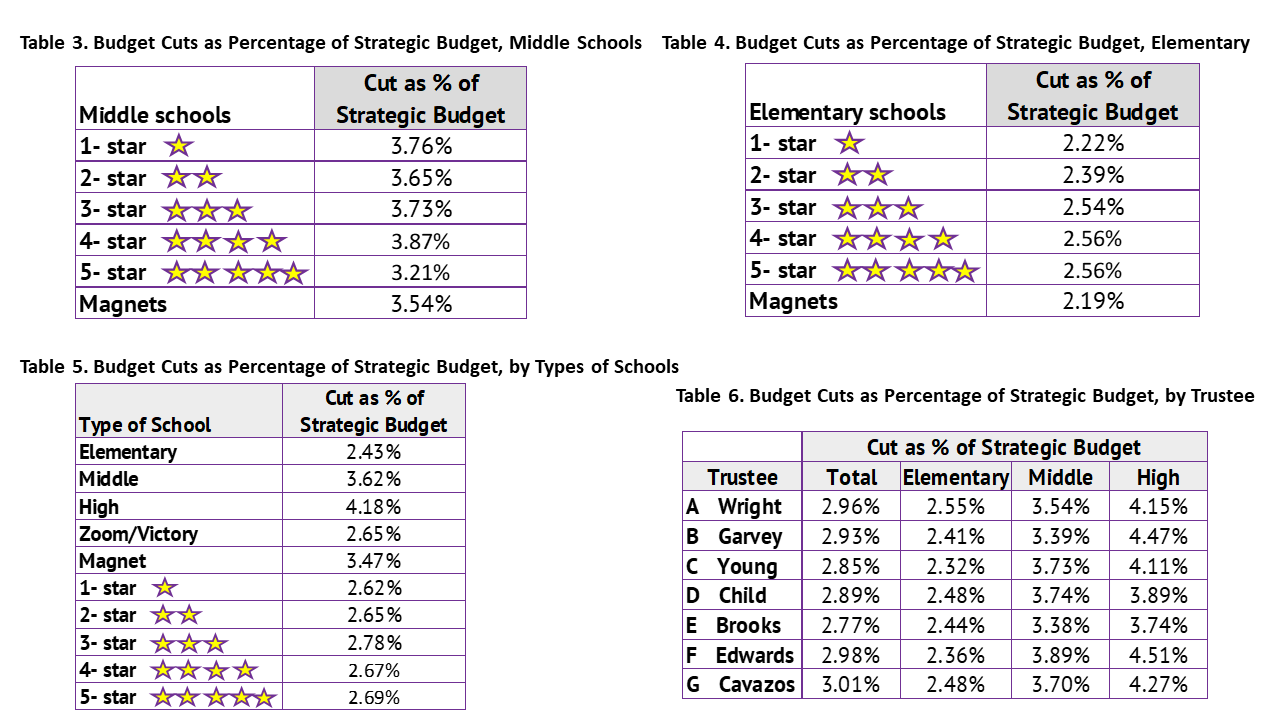
On average, middle schools cut 3.62 percent of their strategic budgets. There was some – albeit minimal – variation in cuts across schools with different star ratings (see Table 3). Staffing cuts in middle schools were less severe than in high schools. Almost two-thirds of middle schools lost at least one licensed staff position (Cadwallader Middle School lost seven and Canarelli Middle School lost five), and one-third of middle schools had to cut one support staff position.
District officials stated that they tried to keep the cuts away from elementary schools, to the extent possible. On average, only 2.43 percent of elementary school strategic budgets were cut. Like middle schools, there was some – albeit minimal – variation in cuts across schools with different star ratings (see Table 4). While high schools were hit hardest by the budget cuts, district officials managed to spread the hardship evenly across different types of schools (Table 5), school board trustee districts (Table 6), and performance zones (Table 7).
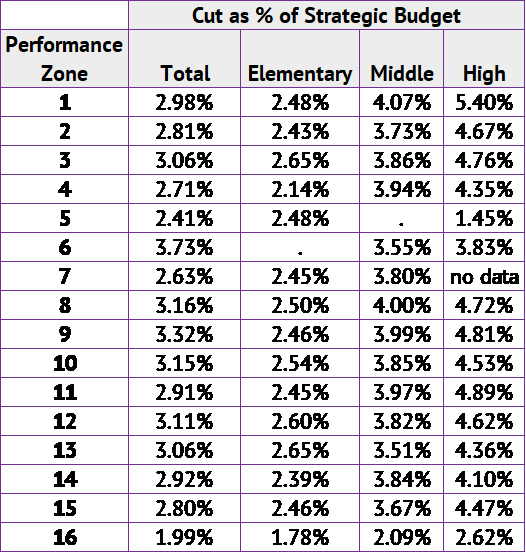
As Table 7 reveals, cuts were distributed relatively evenly across all sixteen performance zones. The average cut per zone ranged from a low of 1.99 percent (Zone 16) to 3.73 percent (Zone 6). The greatest variation in average cuts in high schools ranged from 1.45 percent (Zone Five) to 5.40 percent (Zone 1).
Table 7. Budget Cuts as Percentage of Strategic Budget, by Performance Zone
Many educators and education experts anticipate that the most likely and significant impact of the budget cuts is on the size of classrooms. Nevada Revised Statutes (NRS) Chapter 388.700 requires, for each quarter of a school year, that ratios not exceed 16 to 1 in grades 1 and 2, and 19 to 1 in grade 3. However, to address budgetary constraints, in 2015, the Nevada Legislature (Senate Bill 515) allowed schools to conform to the following student-to-teacher ratios: kindergarten– 16:1; 1st and 2nd grades -17:1, 3rd grade -20:1, and 4th, 5th, and 6th grades – 25:1.
In Nevada, there are no laws regarding class sizes for grades seven to twelve. This means that high schools, which were hit the hardest in budget and staffing cuts, will have to increase their already generally large class sizes. One high school English teacher anticipated that the budget cuts at her school would result in an almost doubling of students in her 9th grade English class.
In closing, we note the challenge we faced in collecting data for this brief piece. More than 75 schools failed to post their Strategic Budget Plan and/or School Performance Plan on their website or failed to report the correct information. The CCSD’s Open Book website is not fully functioning and is difficult to navigate. Stakeholders and researchers across southern Nevada have shared their challenges in requesting and accessing CCSD data. Our hope is that CCSD’s new Superintendent Jesus Jara, Ed.D., who oversaw the launch of an open data “school report cards” system in Orange County Public Schools, will prioritize the robust collection, public presentation, and analysis of data that can inform critical conversations about student outcomes.
