by Daniel Liden
What Are Nevada’s Hard to Count Areas Like?
Our previous census snapshots (focused on 2010 census return rates, areas in Nevada expected to respond to the 2020 census at low rates, and 2010 census return rates and low response scores in Nevada’s cities) have shown the areas of Nevada that are likely to be hard to count during the 2020 census. The next few snapshots will provide more detailed descriptions of the populations of Nevada’s hard-to-count areas in order to categorize and organize the various regions of Nevada and to inform an outreach strategy for hard-to-count areas.
Classification of Census Tracts for the 2020 Census
The Census Bureau Communications Research and Analytics Team (CRAT) conducted research on numerous characteristics of the populations of census tracts, including demographics, media consumption habits, Internet access, and other factors. These characteristics were used to divide census tracts into eight distinct segments with features related to the projected difficulty of obtaining responses to the census. These segments provide a useful framework for understanding the challenges and opportunities in different areas of Nevada and for planning outreach in hard-to-count areas. Descriptions of each of the segments can be found here. Figure 1 shows how Nevada’s census tracts are categorized.
Figure 1: Classification of Nevada’s Census Tracts
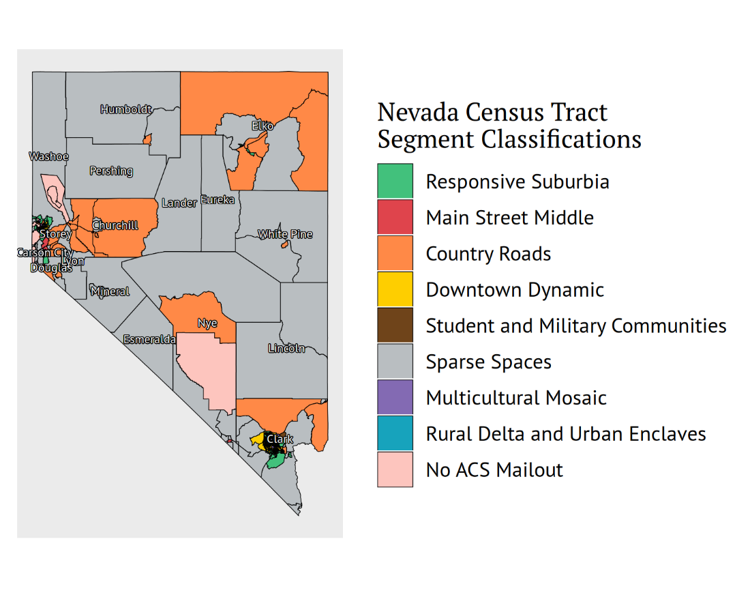
By land area, most of Nevada is classified as “sparse spaces” or “country roads.” More than 75% of Nevada’s population, however, lives in census tracts classified as “responsive suburbia,” “multicultural mosaic,” or “downtown dynamic,” mostly in the Las Vegas area. With the exception of those living in the “responsive suburbia” segment, Nevadans living in all of the above census tract segment types are expected to respond to the 2020 census at rates lower than the national average. Among the most populous census tracts in Nevada, those classified as “multicultural mosaic” are believed to be at the greatest risk of an undercount.
Table 1 shows the percentage of Nevada’s population; the population-weighted average 2010 census mail return rates; and the population-weighted average low-response scores of each census tract segment classification in Nevada. The 2010 self-response rates and low response scores (LRS) are both population-weighted averages of census tracts categorized to each segment.
Table 1: Percentage of Nevada’s population; 2010 self-response rate; and low-response scores by segment
| Segment Name | Percentage of NV Population | 2010 Self-Response Rate | Low Response Score | |
| Responsive Suburbia | 26.4% | 80.6% | 18.4% | |
| Multicultural Mosaic | 25.8% | 73.2% | 27.6% | |
| Downtown Dynamic | 24.0% | 70.7% | 25.9% | |
| Main Street Middle | 11.3% | 80.1% | 20.4% | |
| Sparse Spaces | 7.8% | 80.2% | 19.2% | |
| Country Roads | 3.6% | 78.9% | 21.5% | |
| Student and Military Communities | 0.5% | 70.5% | 31.7% | |
| Rural Delta and Urban Enclaves | 0.5% | 66.1% | 30.2% | |
| No ACS Mailout | 0.1% | — | — |
The next two census snapshots will go into further detail about the Nevadans living in hard-to-count rural (sparse spaces and country roads) and urban (multicultural mosaic and downtown dynamic) segments, respectively. These will focus on characteristics shown to be predictive of census response rates, such as demographics, internet access, education, and home ownership.
Links and Resources
- 2020 Census Audience Segment Descriptions: The Census Bureau provides infographics describing the characteristics of each of the census tract segments and a report detailing how the segment classifications were obtained.
- Response Outreach Area Mapper: The Response Outreach Area Mapper (ROAM) is an interactive map that can be used to identify hard-to-count regions. Clicking on a census tract on the map will provide a demographic and socioeconomic profile of that tracts and will show which segment it belongs to.