by Daniel Liden
The Low Response Score
In our first snapshot about the 2020 census in Nevada, we looked at how many Nevadans responded to the 2010 census. This is an important metric because many of the households and individuals that were hard to count in the 2010 census – such as large transient populations in Nevada’s urban areas and small, widely-dispersed populations in the state’s rural areas – will most likely remain difficult to count in the 2020 census.
However, Nevada has changed in the last ten years. Shifts in demographics, household compositions, college graduation rates, house values, and other factors all impact the likelihood that households will respond to the 2020 census. To address this, the U.S. Census Bureau developed a statistical model that predicts the response rates of census tracts based on updated data from the American Community Survey (ACS). The output of this model is the Low Response Score.
The Low Response Score (LRS)
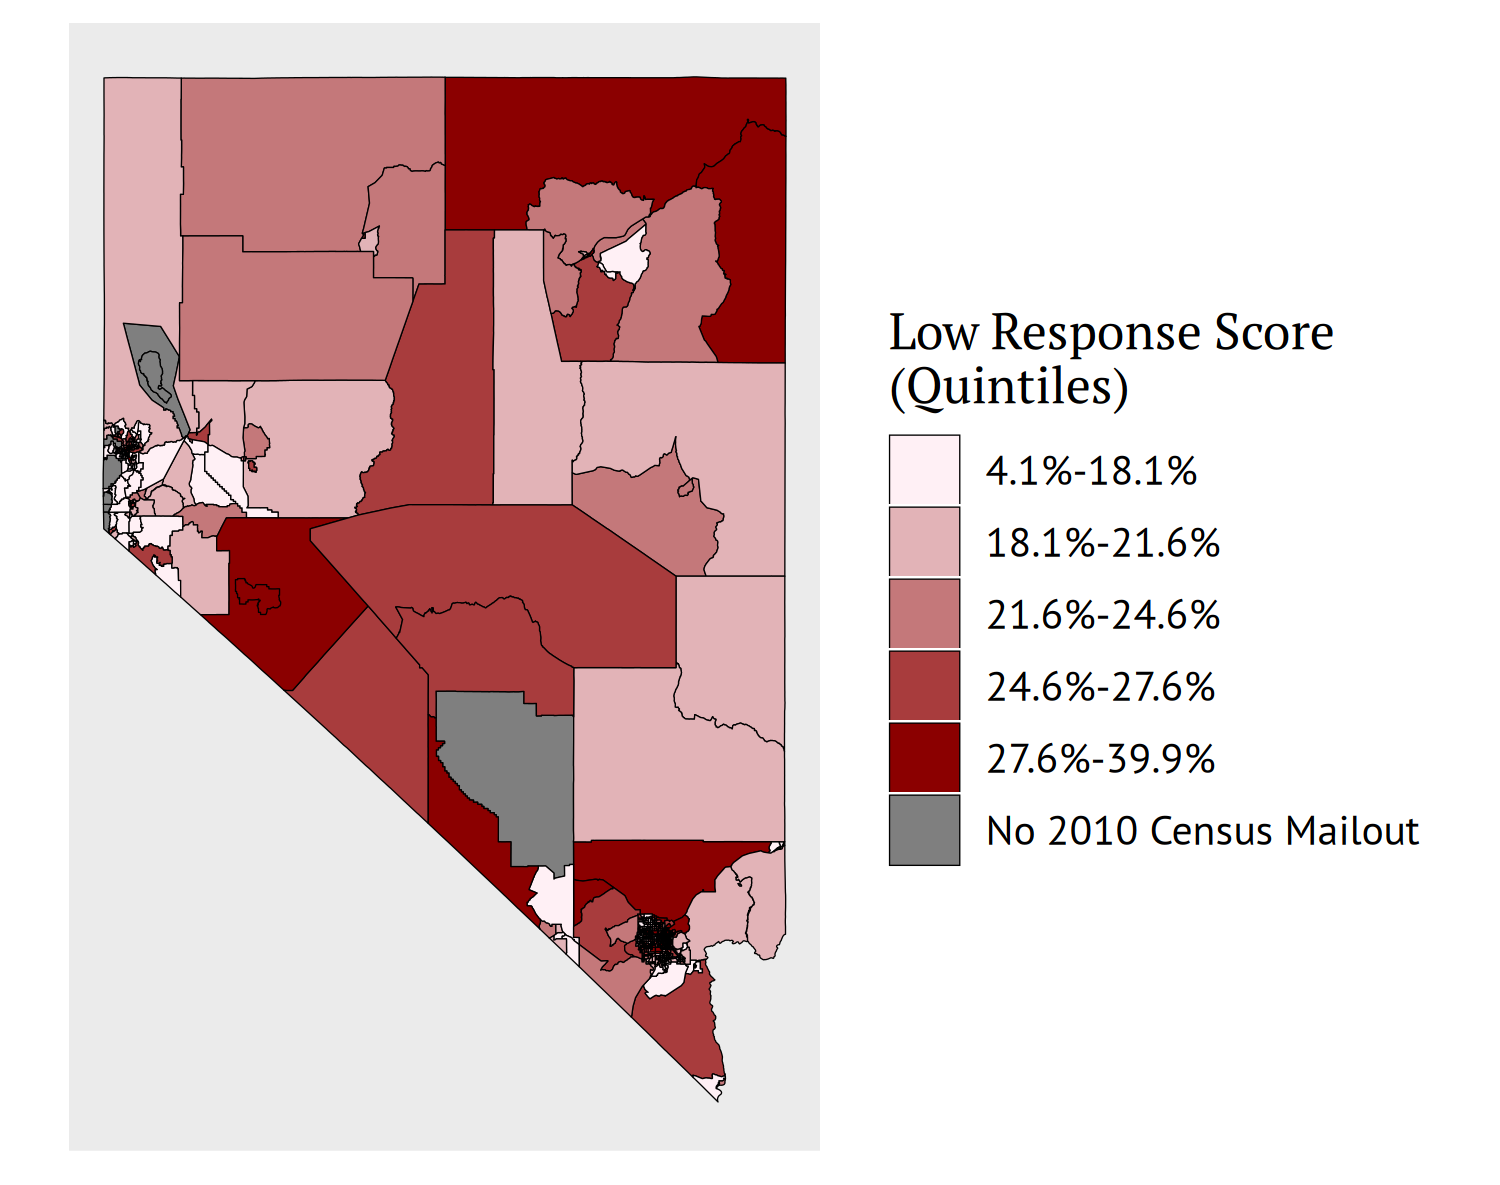
The low response score (LRS) can be interpreted as a predicted “non-return rate,” or the percentage of households expected not to respond to the 2020 census online, by mail, or by phone. A census tract with a high LRS is expected to respond to the 2020 census at a low rate. Figure 1 shows the LRSs for each census tract in Nevada. A future snapshot will focus on the LRSs in the small and densely populated census tracts of Nevada’s urban areas.
Figure 1: Predicted 2020 Low Response Scores
The LRS was generated using a statistical model that predicted non-response rates to the 2010 Census. Key variables included in the model – variables predictive of response rates – include the proportion of households occupied by renters; by younger or older individuals; by a female head-of-household without a husband; and by various racial or Hispanic origin characteristics. Since the model was developed, the LRSs have been updated using new data from the ACS. This ensures that the LRSs are informed by the most recent available data on demographics and other factors. The most recent LRSs, released in 2019 and available in the Census Planning Database, are based on the 2013-2017 ACS data.
Dark red tracts on the map (tracts with high LRS scores) are expected to respond to the census at low rates. The LRS data tell a similar story to that of the 2010 response rate data. Several large tracts with high LRS scores are in Nevada’s rural counties, such as Elko county in the Northeast corner of the state and Lander county nearer the center of the state. Both counties responded to the 2010 census at rates well below the state’s overall rate of 71 percent. Areas of southern and western Nevada that responded to the 2010 census at high rates are expected to do so again in 2020.
The LRSs should be interpreted with some caution. The model from which the LRSs were obtained was developed using the 2010 census mail response rates and cannot fully account for Internet responses, which will be a major component of the 2020 census. This could, for instance, result in overestimated LRSs in urban areas populated by young renters with high rates of Internet use who move frequently. Still, the LRS can provide a rough guide as to which areas in Nevada need the most outreach in order to ensure a strong response to the 2020 census.
Links and Resources
- 2019 Census Planning Database: The planning database (PDB) provides data to aid in research and outreach efforts in preparation for the 2020 decennial census. It includes various relevant ACS estimates and response rates in addition to the tract-level Low Response Score (LRS), a predicted value of non-response rates. It also provides much more detail about response rates to the 2010 census, such as the percentage of census forms that were delivered to households that were ultimately determined to be vacant.
- Response Outreach Area Mapper: The Response Outreach Area Mapper (ROAM) is an interactive map that can be used to identify hard-to-count regions. It also provides “a socioeconomic and demographic characteristic profile of these areas using American Community Survey (ACS) estimates” from the census planning database.
- Hard to Count Map 2020: The CUNY Mapping Service at the Center for Urban Research developed a map for visualizing hard-to-count (HTC) census tracts and for accessing data relevant to response rates. The HTC map also shows the different contact methods (e.g. Internet first; counted in-person, etc.) that will be employed by tract in the 2020 census.
- The Low Response Score (LRS): A Metric to Locate, Predict, and Manage Hard-to-Survey Populations (pdf): This paper, by Chandra Erdman and Nancy Bates, details the development and components of the LRS