by Daniel Liden
Responses to the 2010 Census
The 2020 Census is fast approaching, and Nevada needs an ambitious and far-reaching campaign to count everyone. According to the Urban Institute, Nevada faces an undercount of between 23,900 and 54,700 people. Obtaining a complete count in the 2020 Census is extremely important: according to a report from the George Washington University Institute of Public Policy, Nevada received more than $6.2 billion in fiscal year 2016 from the 55 largest federal spending programs that used data from the 2010 Census to guide funding. Nevada may risk losing around $20,000 in federal funding for each Nevadan who is not counted in the 2020 Census.
In the coming weeks, we will present a series of “census snapshots” highlighting some of the biggest challenges and opportunities associated with the 2020 Census. We begin by investigating the parts of the state that are likely to be difficult to count in the 2020 Census before focusing on specific hard-to-count populations and how to reach them. Along the way, we will provide links to other resources and data sources that could be useful for ongoing outreach efforts.
Response to the 2010 Census
The 2010 mail return rates, or the percentage of non-blank census forms returned by occupied households that received them, provide a useful starting point for predicting which areas will be difficult to count in 2020. Barring major changes in demographics or communications access, the challenges facing the 2020 Census are likely to be similar to those faced in 2010 (see Figure 1).
Figure 1: Mail Return Rates for the 2010 Census in Nevada by Census Tract
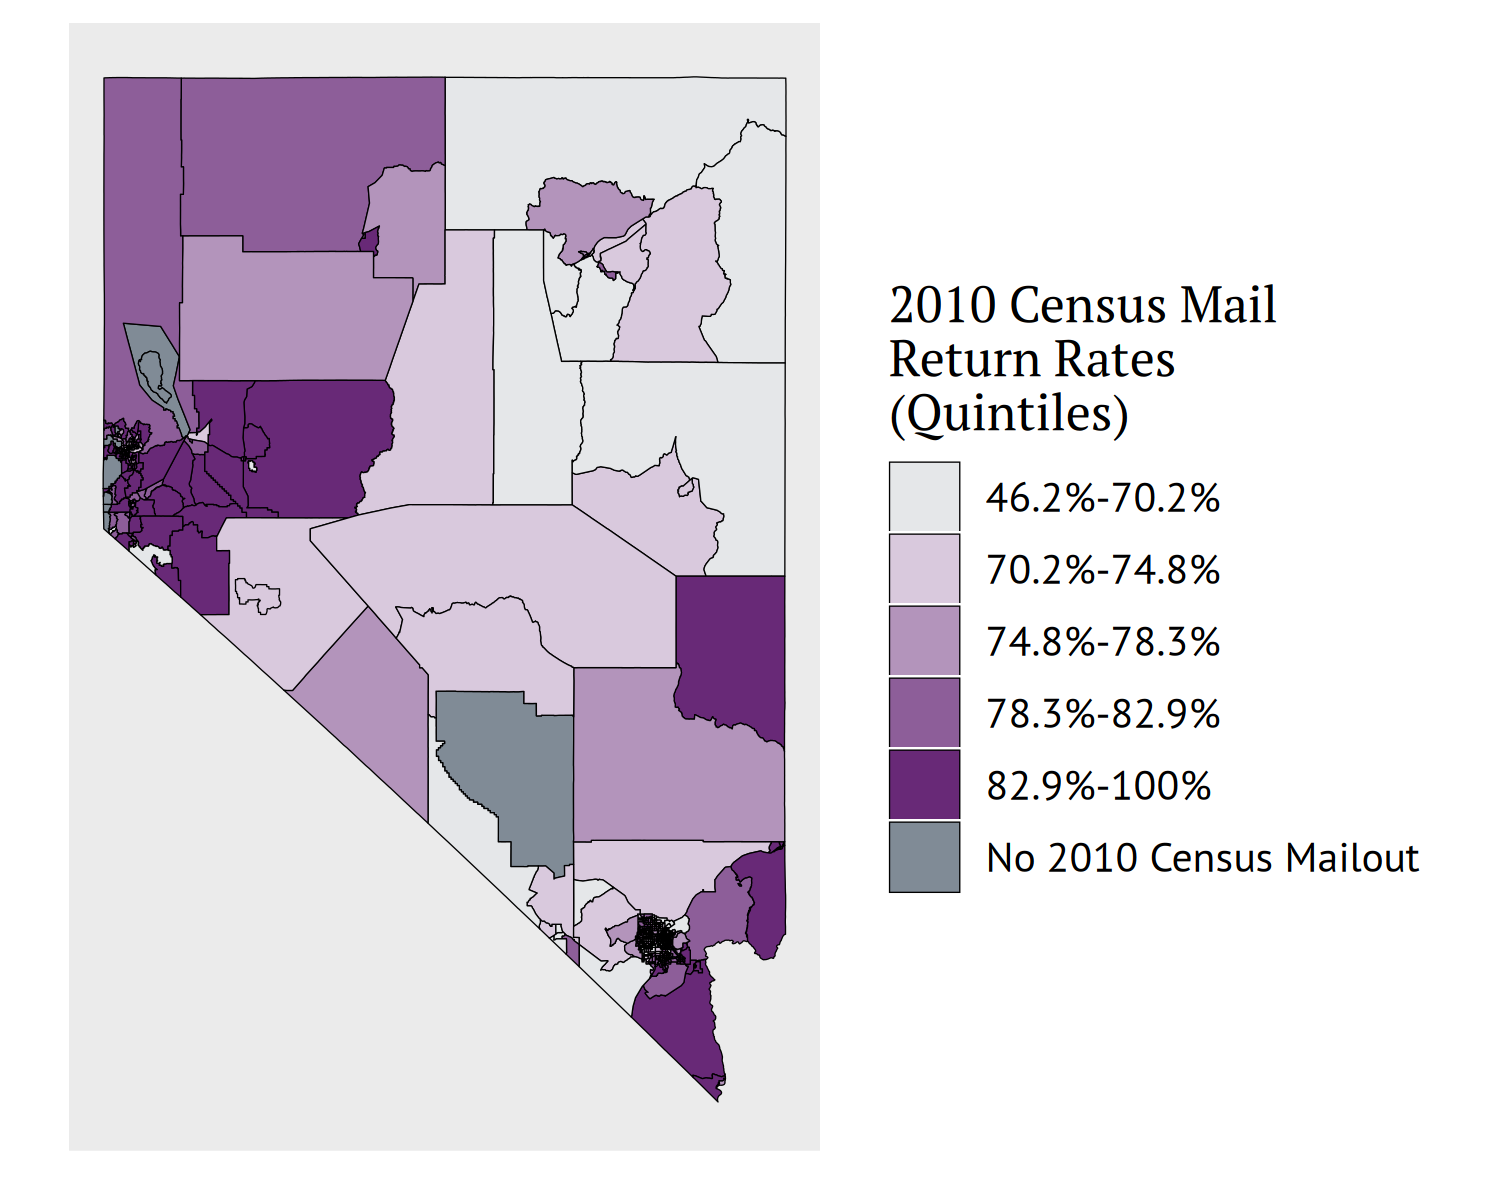
Figure 1 shows that mail return rates for the 2010 Census varied significantly by census tract. The rates shown in the legend are quintiles: approximately one fifth of Nevada’s census tracts saw response rates between 46.2 percent and 70.2 percent; another one fifth of census tracts had response rates between 70.2 and 74.8 percent; etc.
Approximately 71 percent of households in Nevada that received census questionnaires filled them out and returned them in 2010. This compares to a national response rate of approximately 74 percent. Tracts in several of Nevada’s rural counties, such as Elko county in the Northeast corner of the state, saw very low response rates, while many tracts in Southern and Western Nevada had response rates well above the state average.
Some of the lowest response rates to the 2010 Census were recorded in parts of Clark County, particularly in North Las Vegas and areas east of the city of Las Vegas. This will be the subject of a future snapshot: nearly three-quarters of Nevada’s population (73.3 percent) resides in Clark County, so obtaining a high response rate in Clark County is essential to obtaining a high statewide response rate.
While the 2010 response rates provide a useful starting point for thinking about 2020, the 2020 Census stands to be very different. The U.S. Census Bureau intends for the 2020 Census to be the most “automated, modern, and dynamic decennial census in history.” From the perspective of those completing the census, the biggest change is that the 2020 Census can be completed online. Online forms can be made available in multiple languages and can reach individuals who move frequently or lack a permanent address. The use of online census forms will also allow for real-time quality checks and validation using administrative records and other third-party data sources.
Links and Resources
- 2010 Census Mail Response/Return Rates Assessment Report (pdf): this report, developed by the U.S. Census Bureau following the 2010 Census, was intended to “evaluate the impact of the mailing strategy on mail response and mail return rates.” It provides an evaluation of response rates by different demographic characteristics among other details.
- 2019 Census Planning Database: The planning database (PDB) provides data to aid in research and outreach efforts in preparation for the 2020 decennial census. It includes various relevant ACS estimates and response rates in addition to the tract-level Low Response Score (LRS), a predicted value of non-response rates. It also provides much more detail about response rates to the 2010 census, such as the percentage of census forms that were delivered to households that were ultimately determined to be vacant.