On August 15, 2014, the Nevada Department of Employment Training and Rehabilitation (DETR) announced that Nevada’s unemployment rate for July 2014 was 7.7 percent. The good news is that Nevada’s unemployment rate has been steadily declining since the high of 14.4 percent in 2010 (see Figure 1). However, the standard, official unemployment rate leaves out many discouraged workers who want and are available for work, as well as workers employed part-time for economic reasons. Taking these factors into account, Nevada’s unemployment rate climbs to 17.4 percent for the period of Q2 2013 through Q1 2014.
Official Unemployment Rate Shows Improvement but Continued Economic Strain
Figure 1 shows the annual averages for the official unemployment rate from 2003 to 2013 for Nevada and the United States. Prior to the Great Recession, Nevada’s unemployment rate was lower than the national rate. Since the Great Recession began in 2008, Nevada’s unemployment rate has consistently been higher than the national rate. While the unemployment rate for the United States and Nevada have both declined since the peak in 2010, rates are still much higher than before the Great Recession.
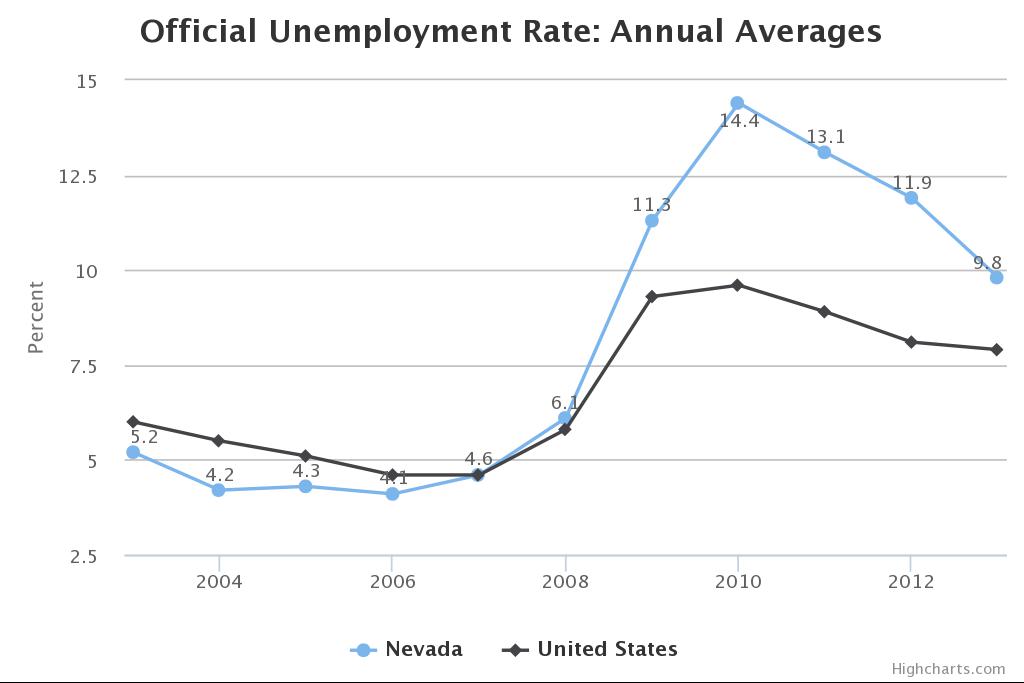
Source: Bureau of Labor Statistics
Alternative Unemployment Measure Reveals Workforce Challenges
Many people who have been unable to find work are left out of the standard, official unemployment rate. The U.S. Department of Labor’s Bureau of Labor Statistics collects data on several alternative measures of unemployment. The most comprehensive measure is called U-6. It includes the total unemployed, plus all marginally attached workers and total employed part-time for economic reasons. Marginally attached workers are persons not in the labor force who want and are available for work, and who have looked for a job sometime in the prior 12 months (or since the end of their last job if they held one within the past 12 months), but were not counted as unemployed because they had not searched for work in the 4 weeks preceding the survey. Discouraged workers are a subset of marginally attached workers.
Figure 2 shows annual averages for Nevada and the United States for the U-6 measure from 2003 through 2013. While the patterns in the graph are similar to Figure 1, the percentages are much higher. At its peak in 2010, the rate for U-6 was 23.6 percent in Nevada and 16.7 percent for the nation. In 2013, Nevada’s rate was still 18.1 percent, which far surpasses the rate of 7.6 percent in 2007 before the Great Recession.
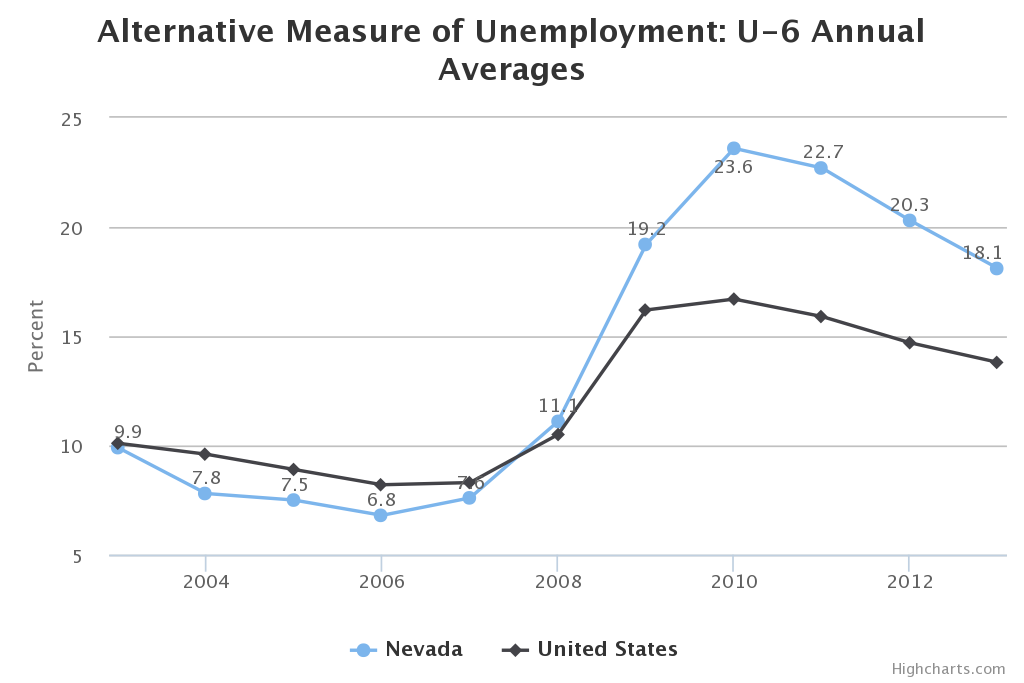
Source: Bureau of Labor Statistics
This alternative measure of unemployment (U-6) reveals Nevada’s vast untapped workforce, and illustrates the continued need to create jobs and to ensure that there is alignment between worker skills and employer needs. As Nevada works to diversify its economy through the work of the Governor’s Office of Economic Development, it is imperative that workers have the 21st Century skills that employers demand. The Guinn Center for Policy Priorities is currently doing research in the area of economic and workforce development. Upcoming policy reports will emphasize the state of Science Technology Engineering and Math (STEM) education in Nevada and other economic development issues.