by Kenneth J. Retzl, Ph.D.
In our previous blog post regarding comparative proficiency rates on the Smarter Balanced Assessment (commonly referred to as the SBAC), we discovered that changes in SBAC proficiency rates between grade levels were consistent across all SBAC states. This blog now examines the results against the Nevada Department of Education’s goal to become the fastest improving SBAC state. Using data from the Nevada Report Card, and other SBAC states’ longitudinal data systems, we visualize the change in SBAC English Language Arts (ELA) and mathematics proficiency rates between 2016 to 2019 — the years Nevada has administered the SBAC. What we find is that Nevada is never the state with the largest increase in proficiency rates, but the Silver State’s change is always positive and always in the top half of SBAC states.
SBAC ELA
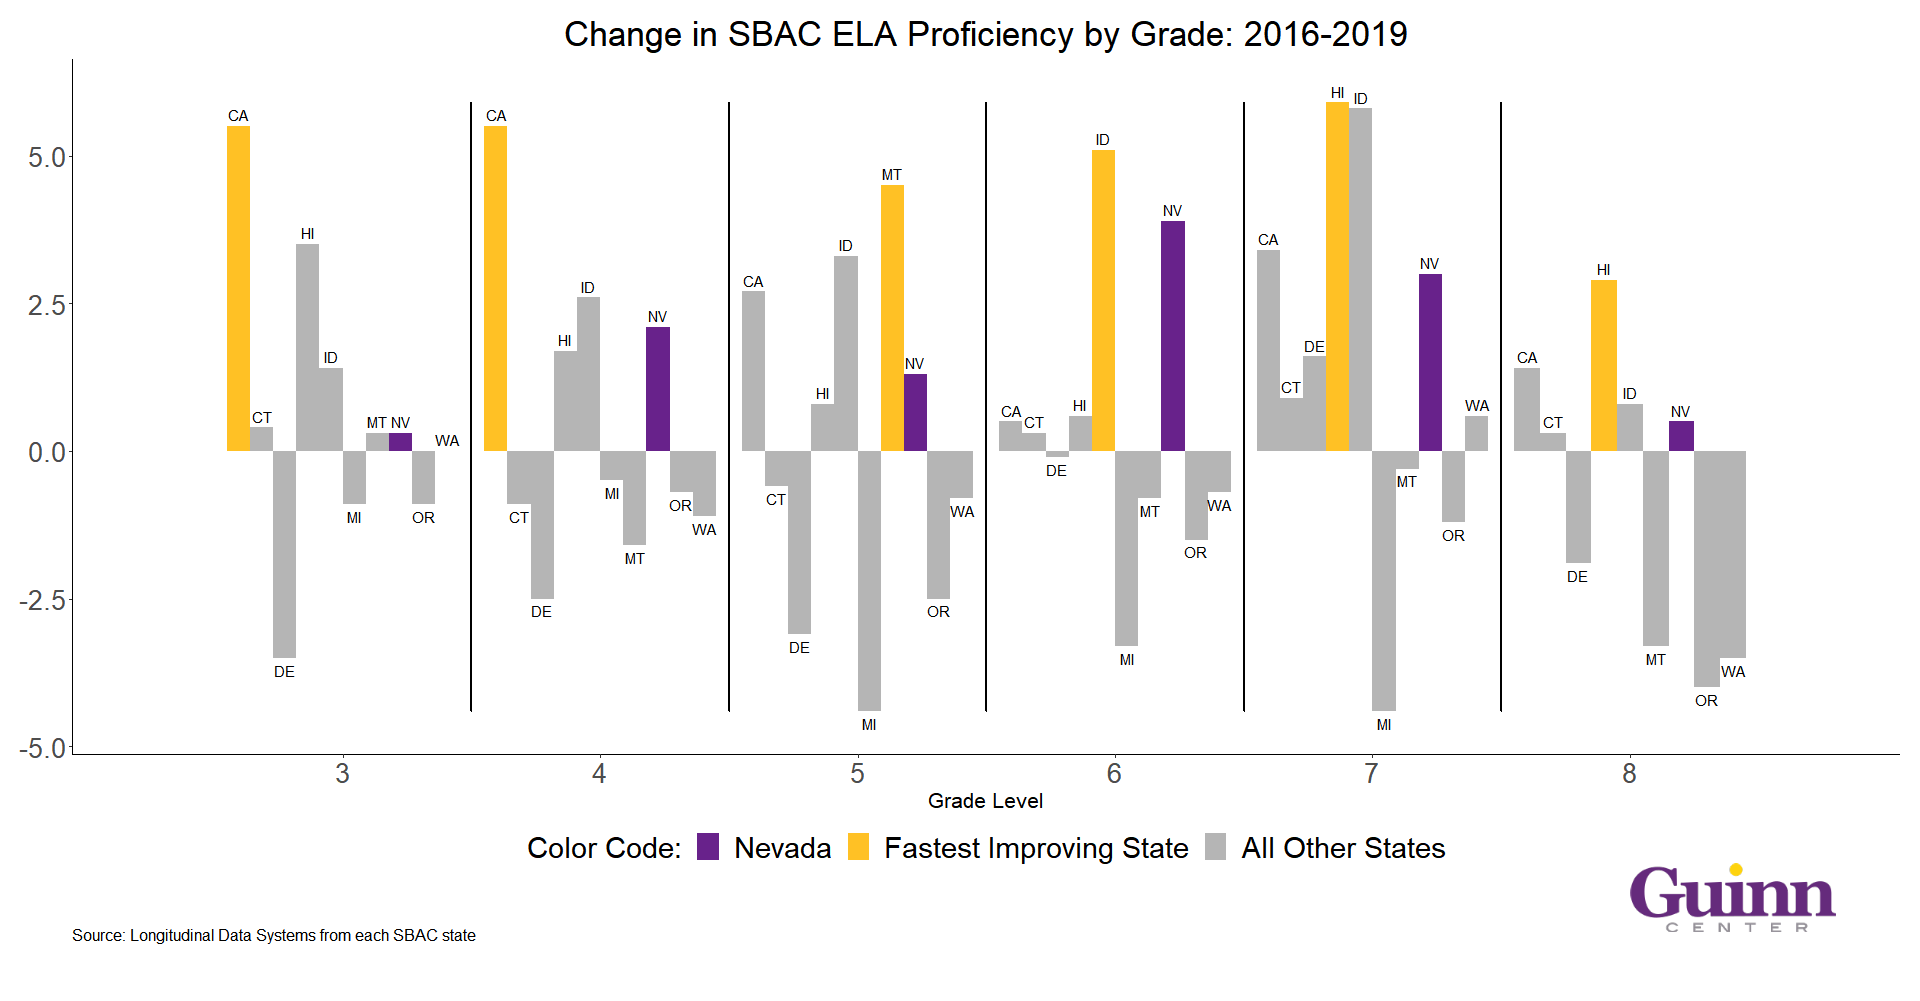
Figure 1 presents the grade level change in SBAC proficiency rates in grades 3 through 8. Of the ten states where data is available (there are 11 SBAC states with scores from 2016 to 2019 but Vermont has not yet released its 2019 results), Nevada is one of only four states that experienced an increase in proficiency rates in each grade. California, Hawaii, and Idaho also share that honor.
Nevada never has the largest absolute increase in proficiency rates (which would make it the fastest improving state), but is second to Idaho in the 6th grade. In all other grade levels, Nevada’s change in proficiency rates never ranks worse than fifth of the ten states.
Figure 1 – Absolute Change in SBAC ELA Proficiency Rates
SBAC Mathematics
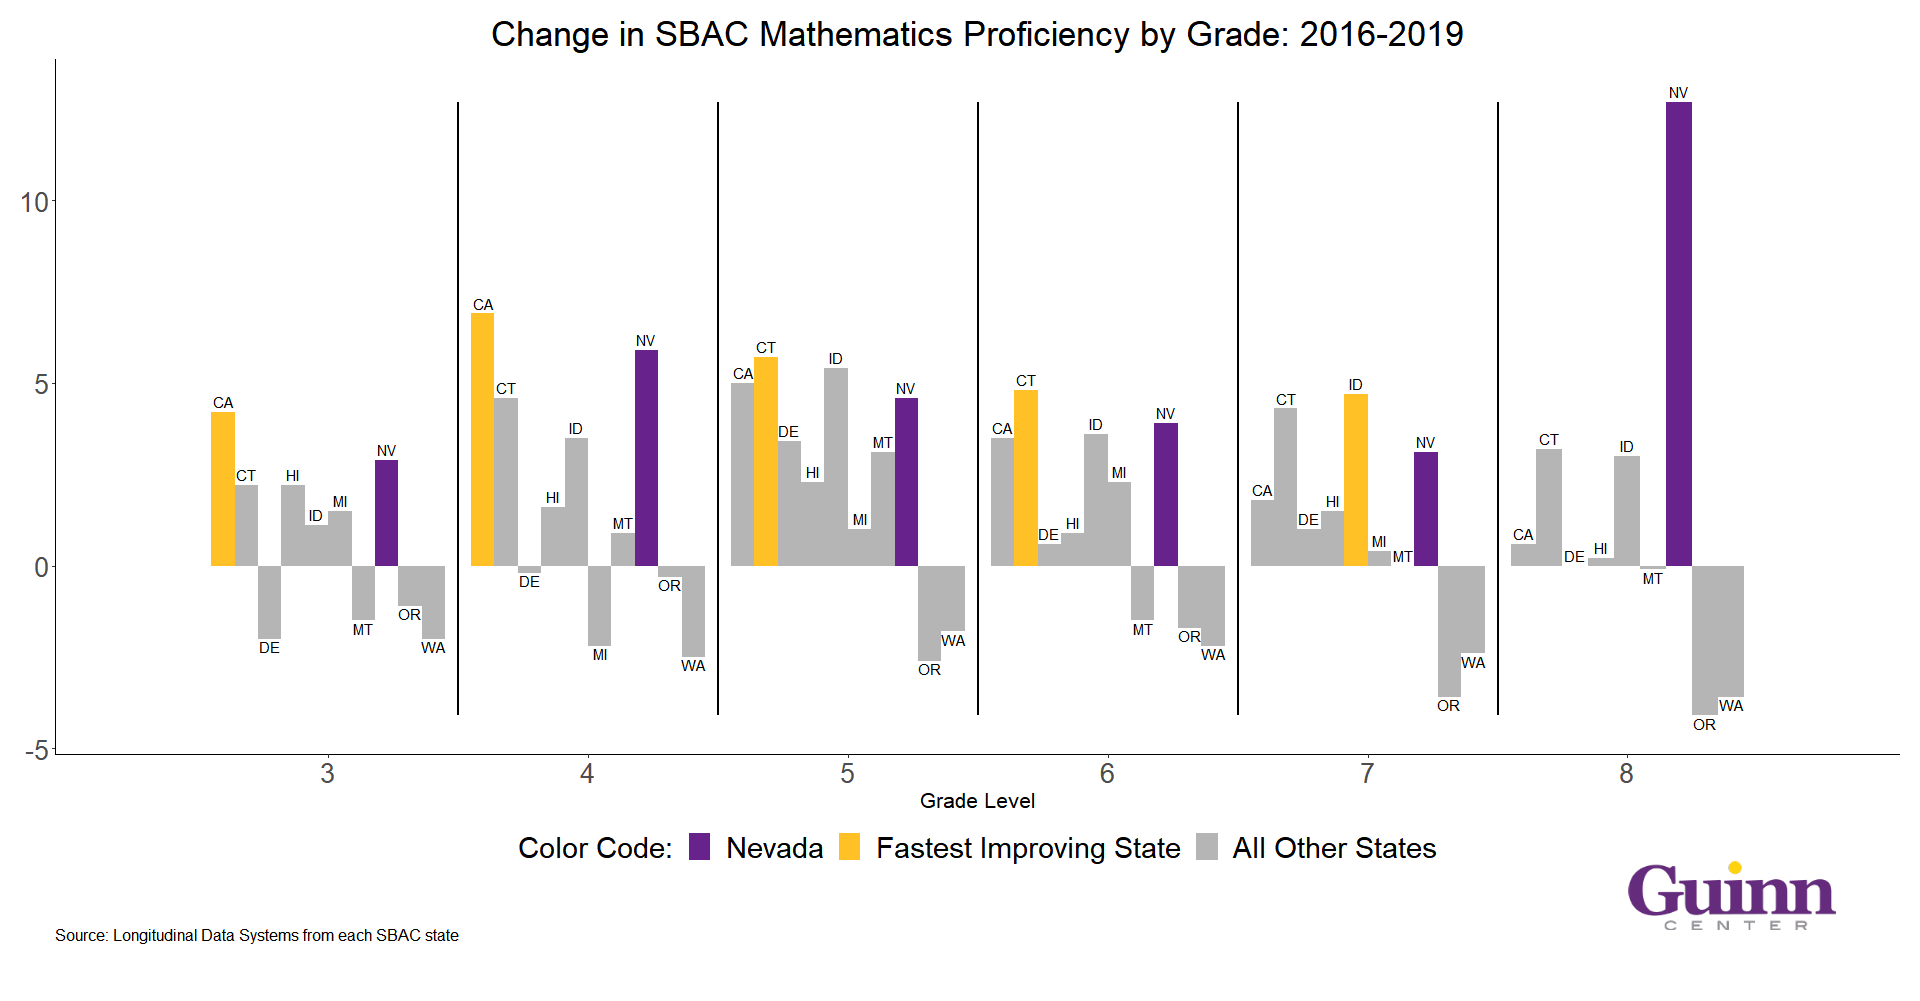
Like the ELA portion of the SBAC assessment, Nevada did not experience a reduction in mathematics proficiency rates at any grade level (see Figure 2). The Silver State is one of five states which experienced positive growth – California, Connecticut, Hawaii, and Idaho are the others.
While Nevada did demonstrate the largest increase in mathematics proficiency rates in 8th grade, we note that this change displayed is actually a result of a Nevada policy alteration [or revision]. In the first years of the SBAC, Nevada’s 8th grade students that were enrolled in algebra did not participate in the SBAC; instead they were given an end of course exam. Beginning in the 2017-2018 school year, these students took the SBAC exam. For comparison, Nevada’s results in 8th grade are included in Figure 2, but it is not possible to know what the actual change in proficiency rates is given the two different subsets of students tested over the period.
Excluding the 8th grade results, Nevada still compares favorably to all SBAC states. In three grade levels, Nevada students experienced the second largest increase in mathematics proficiency rates. In the other two grade levels, Nevada ranked third and fourth.
Figure 2 – Absolute Change in SBAC Mathematics Proficiency Rates
Conclusions and Cautions
Comparing the proficiency data across all SBAC states, we note that Nevada compares favorably to others.
- In ELA, Nevada is one of four states that experienced an increase in proficiency rates in every grade level between 2016 to 2019. Additionally, while Nevada never had the largest change in proficiency rates, it was in the top half of SBAC states at each grade level tested.
- In mathematics, Nevada is one of five states that increased its proficiency rate in every grade level between 2016 to 2019. Although Nevada did not exhibit the largest increase in proficiency rates (see note above why the 8th grade results should be disregarded), it was the second fastest growing state in three grade levels and was the third and fourth fastest improving in the other two grade levels.
This analysis would suggest that Nevada is not yet the fastest improving state on the SBAC assessment. However, it is important to note the Guinn Center is unsure how the State of Nevada intended to evaluate this goal. In creating this blog, we chose to define it as the grade level change in proficiency rates:
2019 proficiency rate minus 2016 proficiency rate for each grade level
However, it could also be calculated as the rate of change:
(2019 proficiency rate minus 2016 proficiency rate) / 2016 proficiency rate
Using student growth data would be another interesting way to measure improvement. However, current student growth measures are only calculated using each state’s data (Nevada’s student growth data is relative only to other Nevada students, not to all students in SBAC states). Using this measure would require a change in scoring procedures on the part of the administrators of the SBAC.
So, it is with the caveat that when using the absolute change in SBAC proficiency rates, Nevada is not yet the fastest improving SBAC state. However, we believe Nevada’s students and educators should be praised for the universal increase in proficiency rates in both the ELA and mathematics portion of the exam over the period from 2016 to 2019.