by Kenneth J. Retzl
Every Spring, 3rd to 8th grade students in Nevada as well as several other states gather around computers to take the Smarter Balanced Assessment. This test, often referred to as the SBAC, is the (partial) basis upon which elementary and middle schools are awarded points in the Nevada School Performance Framework (NSPF). Students take both a Mathematics and English Language Arts (ELA) assessment, with scores reported separately. Nevada began using the SBAC in 2015, but because of a testing irregularity, the first year of valid results was 2016. While not every state uses the SBAC to measure student achievement, ten other states, in addition to Nevada, have used the SBAC from 2016 to 2019: California, Connecticut, Delaware, Hawaii, Idaho, Michigan, Montana, Oregon, Vermont, and Washington.
Analyzing the SBAC data from Nevada and the other 10 states (with data pulled from the respective states’ education data portals), the Guinn Center noted several trends and compared how Nevada performed against other SBAC states – an important task considering Nevada has declared its primary education goal is to become the fastest improving state in education. At the time this blog was published, all SBAC states had reported their 2018-2019 results except for Vermont.
Our review of recent SBAC results finds that the change in proficiency rates by grade-level are uniform across states and content areas – meaning that the change in proficiency rates for all states either go up or down depending on content area and grade-level. Additionally, we note the transition to middle school is related with a decline in ELA proficiency rates. Both findings suggest additional research is necessary to fully understand the causal drivers of the results.
SBAC Mathematics
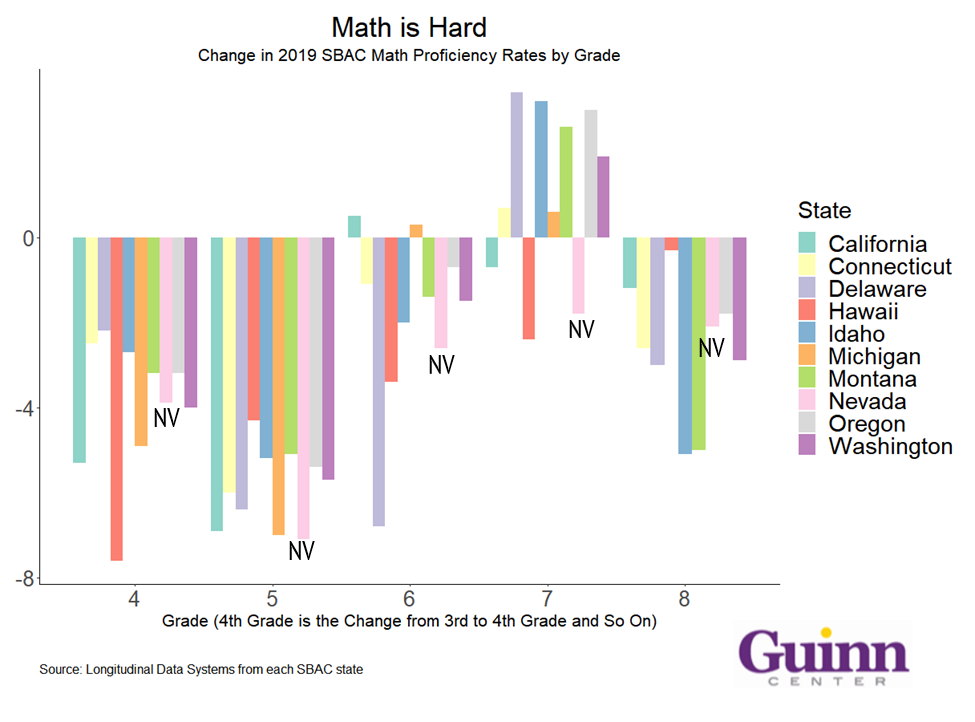
Looking first at SBAC mathematics results, Figure 1 plots the change in proficiency rates for the 2018-2019 assessment between grade levels. For example, the grade 4 results reflect the 4th grade proficiency rates less 3rd grade proficiency rates (reflecting an estimated difference in proficiency rates between grade-levels). What we find is that in nearly every grade the mathematics portion of the SBAC is administered, the exam becomes harder for all students to perform at proficiency. This finding is slightly less pronounced in 7th grade; but other than this, it is very rare for a cohort of grade-level students to experience an increase in proficiency rates over the prior grade. There are (at least) two plausible explanations:
1) cohorts of students at each grade level, in every SBAC state, are less proficient/capable than the cohort of students behind them, or
2) the mathematics standards that are tested at each grade level become more rigorous each year, resulting in a consistent decline in proficiency rates.
We believe the second explanation better fits the data – math is hard.
Figure 1 – SBAC Mathematics Results
SBAC ELA
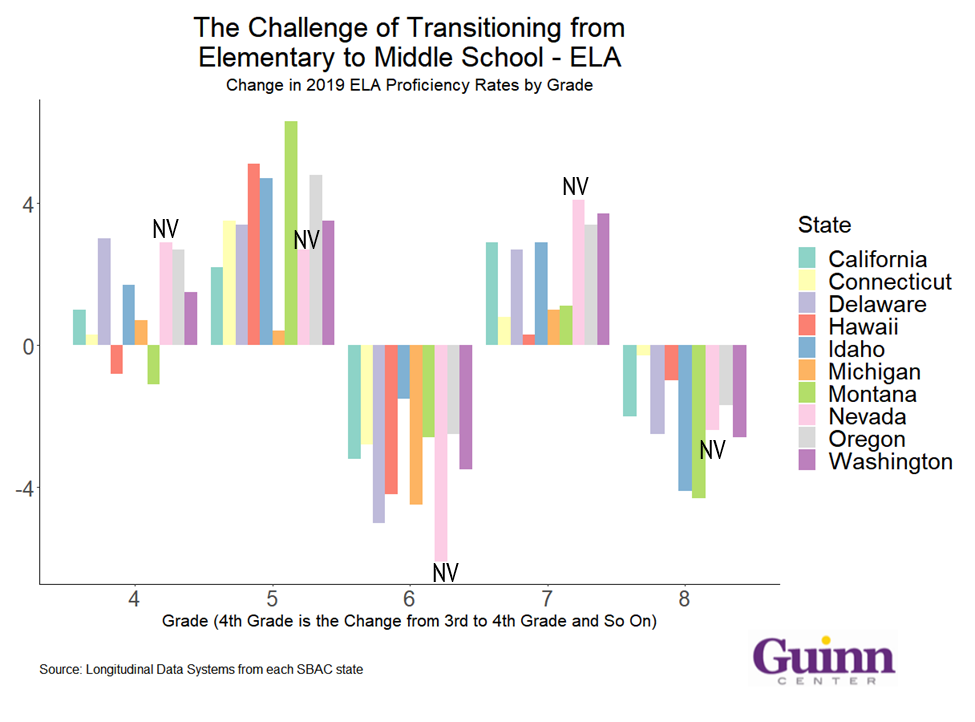
Figure 2 presents a similar analysis using the ELA portion of the SBAC assessment. Using the same data and procedures as above, we note that students in most grades experience increases in ELA proficiency. However, the two grades that this does not occur in are 6th and 8th grades. What is most interesting is that these increases (decreases) in proficiency are experienced nearly universally across grades in all SBAC states. This would suggest something is occurring universally in both 6th and 8th grades that is pulling proficiency rates down. We propose the following two potential explanations:
- Consider that 6th grade is commonly the first year of middle school, which is fraught with change and challenges. Research suggests that this transition from elementary to middle appears to significantly impact student achievement.
- 8th grade results present more of a puzzle. At each grade level and subject area (ELA and Mathematics) students are required to complete a performance task. Upon reviewing documentation from SBAC and member states, it is not evident that anything is different in the grade 8 ELA assessment than the previous grades’ tests. Given this, (and the overall declining rates in mathematics), it might be pertinent to review the grade-level test questions and/or the proficiency cut scores to better reflect the teaching that is occurring at this grade (or at least to understand where the pitfalls are that are preventing students from mastering the content).
Figure 2: SBAC ELA Results
Nevada Results
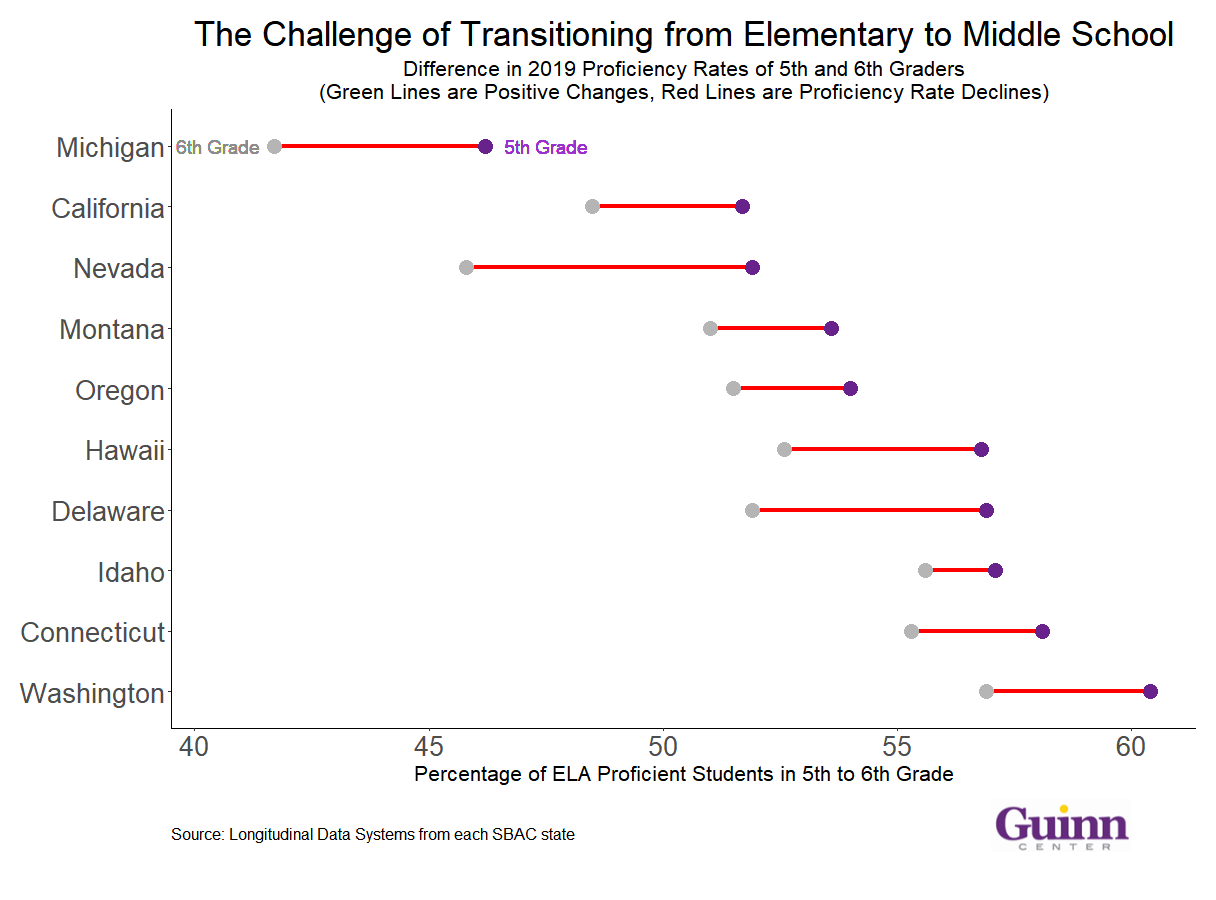
Turning to Nevada, specifically as it relates to the transition from elementary to middle school and the impact on ELA results, Figure 3 suggests that while Nevada has the third lowest 5th grade ELA proficiency rates of the SBAC states, it also has the largest decline in grade level proficiency in 6th grade. This leads us to conclude that the transition from elementary to middle school is difficult for students but appears especially difficult for students in Nevada.
Figure 3: A Closer Look at the Impact of the Transition to Middle School
Moving Forward
Some additional interesting findings include:
- Math proficiency rates decrease as the grade level increases. These decreasing rates occur uniformly across states, with no regard of the actual proficiency rates of the states (i.e. it occurs whether the state has a comparatively higher or lower proficiency rate).
- The ELA proficiency rates increase each year until 6th grade, which coincides with students’ transition to middle school. The proficiency rates increase again in 7th grade, but then decrease in 8th This 8th grade decline in ELA proficiency rates is found across all states, with no apparent explanation.
These findings suggest two policy research agendas, one for school districts/state departments of education and one for the SBAC assessment.
For School Districts/State Departments of Education – Seek to understand why the transition to middle school is so detrimental to student achievement and put in place supports to lessen the impact of that transition. This is especially important in Nevada, which has the largest decrease in ELA proficiency rates from the 5th to 6th grade. We applaud recent efforts at Clark County School District to pilot new programs at a selection of its under-performing middle schools.
For the administrators of the SBAC assessment – There are clear trends in assessment results across states. We would expect random variation in changes in proficiency rates across grades and states. However, what we observe is changes in proficiency rates appear to move in unison across all states (see Figures 1 & 2). SBAC may want to reevaluate its testing content and/or proficiency cut scores to better assess student proficiency.
The stakes of the SBAC assessment are high for both students and the districts that serve them. Because of this, it is important to both understand the difficulties students have with the content, as well as to ensure that the cut scores determining grade-level proficiency are set appropriately.