by Kenneth J. Retzl, Ph.D.
Introduction
Every year Education Week publishes Quality Counts, a ranking of the education systems in each of the 50 states and District of Columbia. In the 2018 report, Nevada ranked 51st. However, the methods to create this overall ranking are complicated, with Education Week aggregating 39 different variables that are grouped into three categories (Chance for Success, School Finance, and K-12 Achievement).
- The “Chance for Success” category includes 13 variables that intend to measure the quality of an individual’s life from infancy through their career.
- “School Finance” includes 8 variables measuring how a state funds education.
- The “K-12 Achievement” category comprises 18 variables, including mathematics and reading performance, graduation rates, and Advanced Placement assessment results, as well as an indicator that assesses a state’s success in closing its poverty-based opportunity gaps.
In the 2018 rankings, Nevada ranked 50th in Chance for Success; 48th in School Finance; and 40th in K-12 Achievement. The 2018 K-12 achievement ranking represents a decline from 38th in 2016 and 36th in 2014.
The remainder of this analysis will focus specifically on K-12 Achievement and will examine trends in Nevada since 2014. Here we note that one way to review the data is to examine the numbers and trends in an absolute sense. When doing this, a reader can make judgements as to whether the proficiency rate/gaps in achievement/graduation rate is acceptable. Another way to consider the data is how the indicator in question compares to other states (or, reviewing the data from a relative perspective). Both absolute and relative data will be presented.
The National Assessment of Educational Progress (NAEP)
The National Assessment of Educational Progress (NAEP) is an assessment given to a representative sample of students in every state and the District of Columbia. Several content areas are tested, but results are only aggregated at the state-level for the reading and mathematics portion of the assessment.[1] Additionally, the assessment is generally given once every other year (to students in the 4th and 8th grades). Because of this, Education Week’s K-12 Achievement measure is only updated every two years (whereas the Chance for Success and School Finance categories are updated annually).
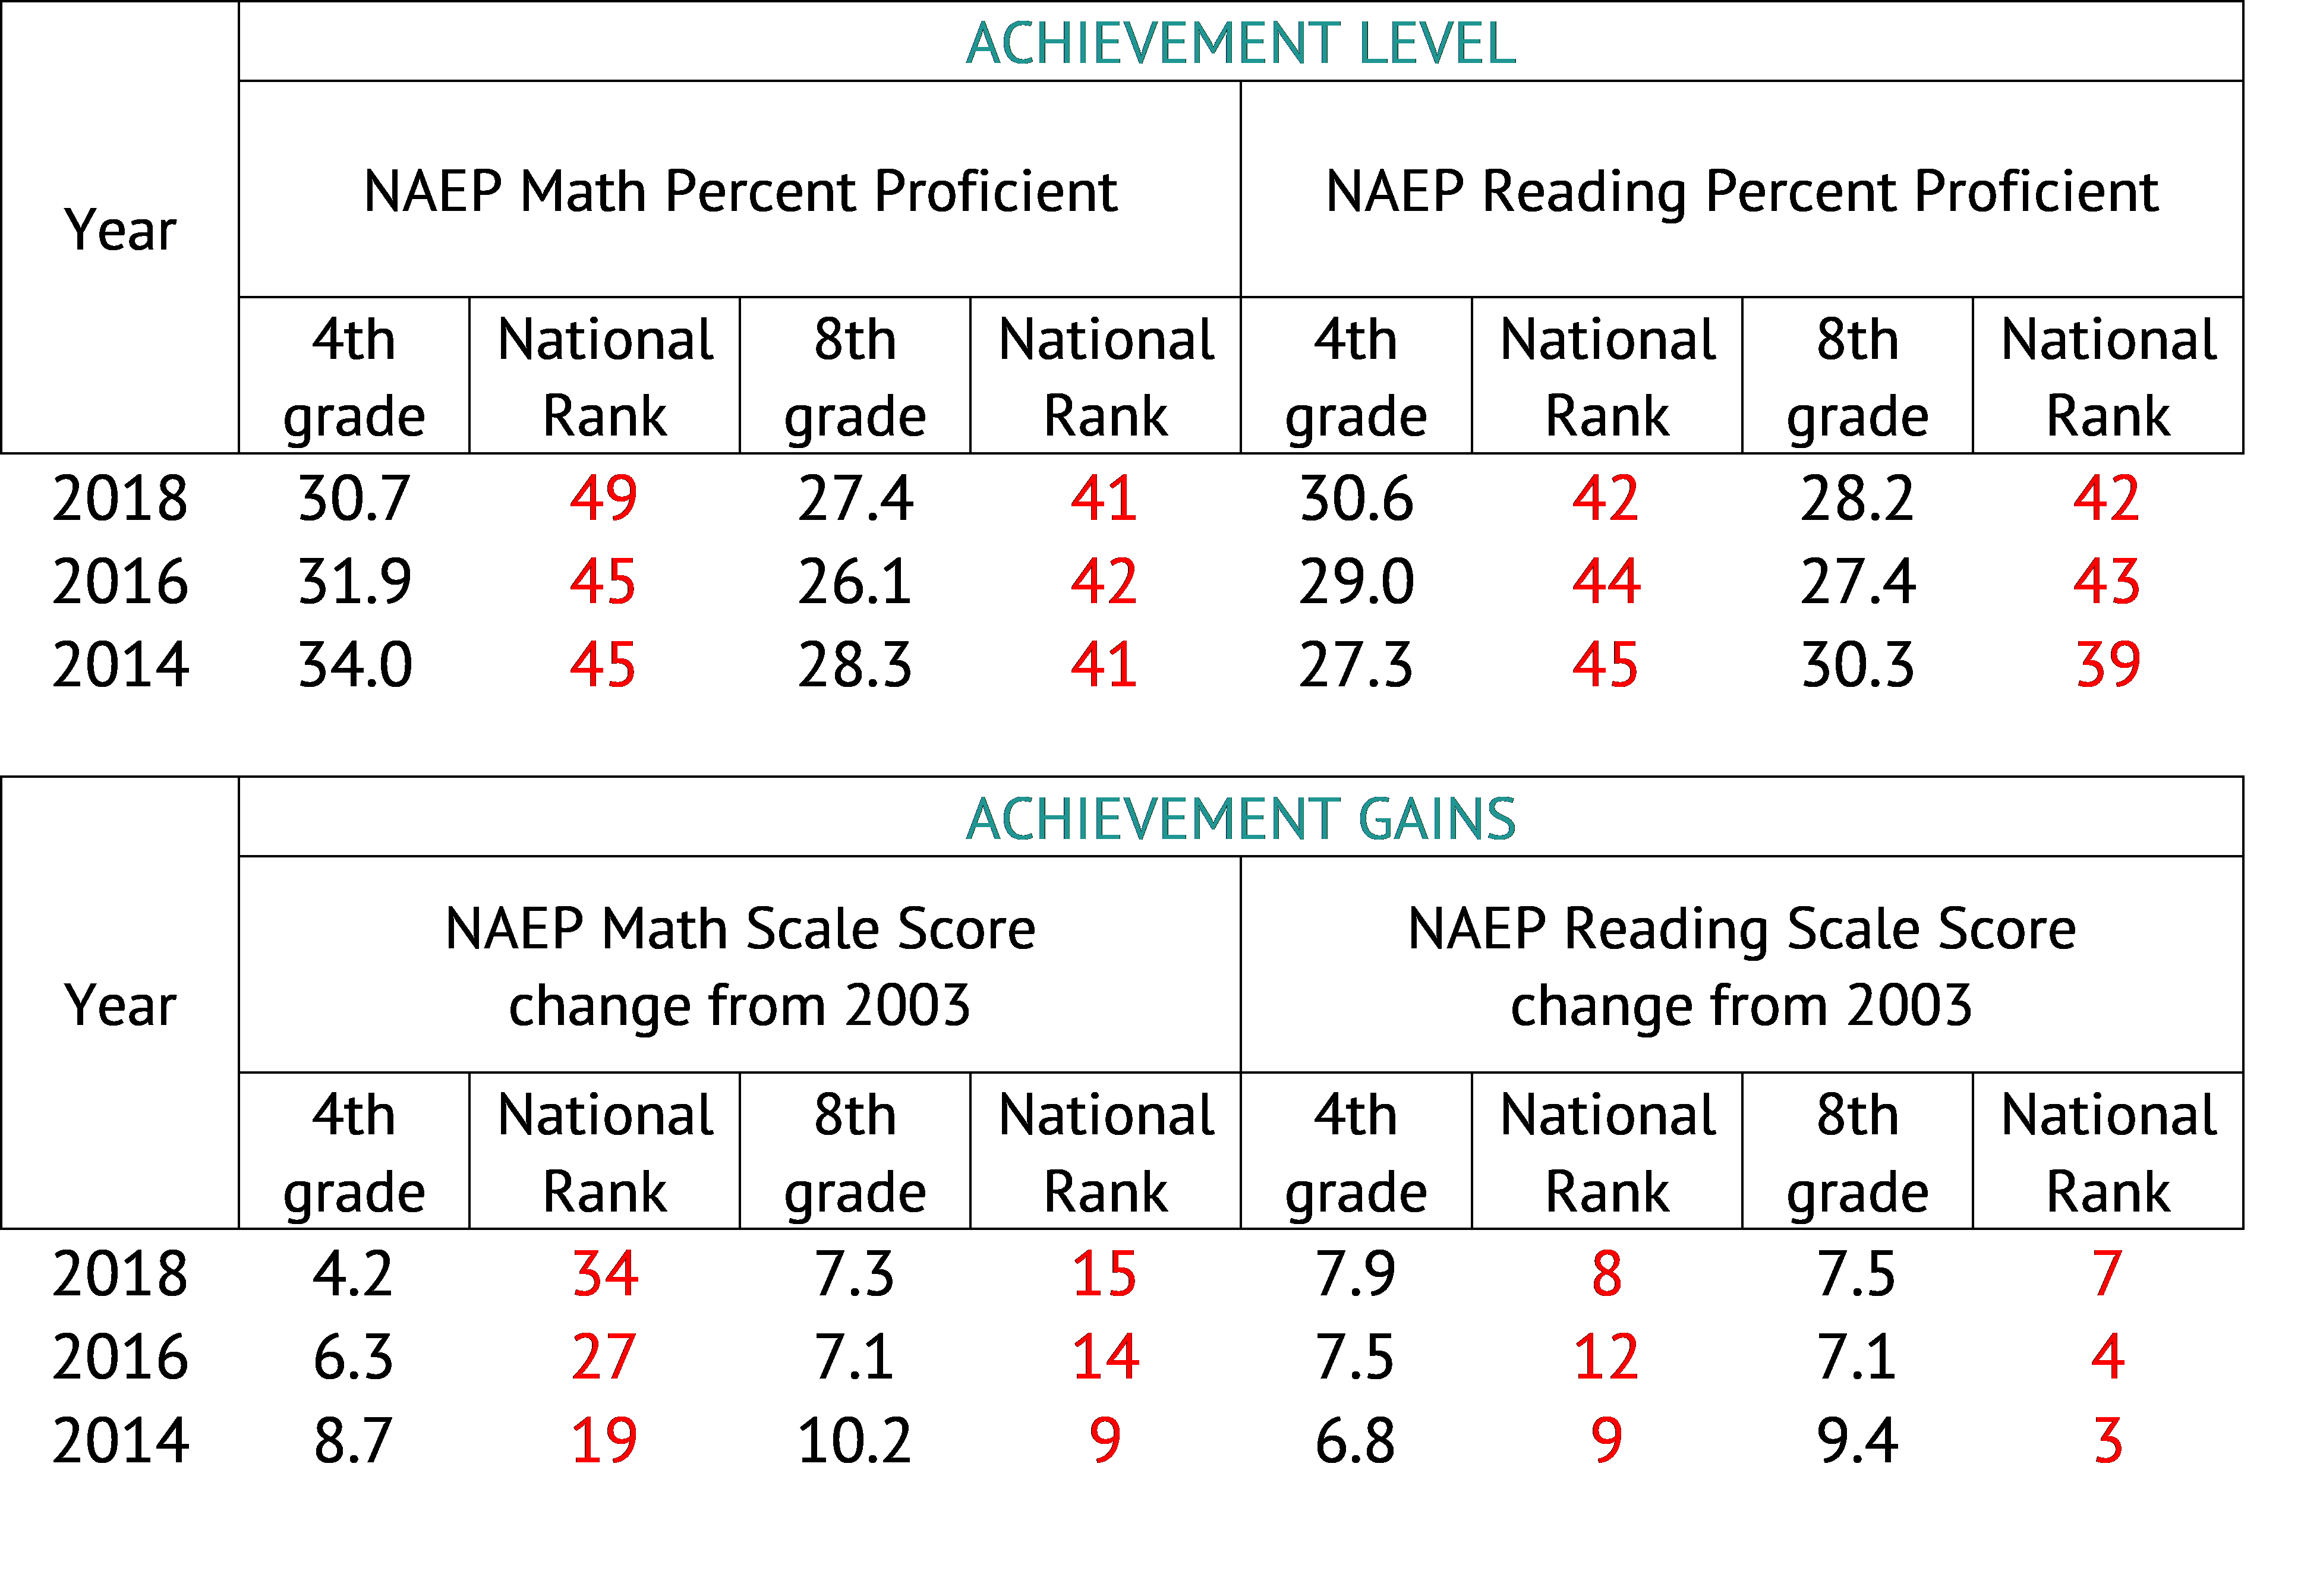
Table 1 displays how Nevada students fared on the 2017, 2015, and 2013 NAEP assessment, which is reflected on Education Week’s Quality Counts ratings in the subsequent years (2018, 2016, and 2014, respectively). Proficiency rates on the mathematics portion of the NAEP decreased from 2014 to 2018 in both 4th and 8th grades. The decrease in 4th grade math proficiency resulted in Nevada falling several spots compared to other states. In 8th grade, Nevada held constant compared to other states. Fourth grade reading proficiency increased from 2014 to 2018, resulting in an increase of three spots in the national rank. However, the 8th grade proficiency rate dropped, resulting in the loss of three spots from 2014 to 2018.
Unsurprisingly, a similar pattern is observed in Achievement Gains (the change in NAEP scale scores since 2003). Because proficiency rates are trending downward (except for 4th grade reading), the change from 2003 proficiency levels is also decreasing in the three years analyzed. However, for the change in 4th and 8th grade reading proficiency, Nevada is in the top 10 of all states.
Table 1 – Nevada NAEP Results – Proficiency and Scale Score: 2014 – 2018
Unfortunately for Nevada, the gap between the scale scores of students who are and are not eligible for Free-and-Reduced Price Lunch has also increased between 2014 to 2018 (see Table 2). In this case, lower numbers are better, suggesting a smaller achievement gap between the two categories of students. This growing gap has resulted in Nevada falling toward the bottom of all states for addressing the poverty gap.
Table 2 – Nevada NAEP Results – Poverty Gap: 2014 – 2018
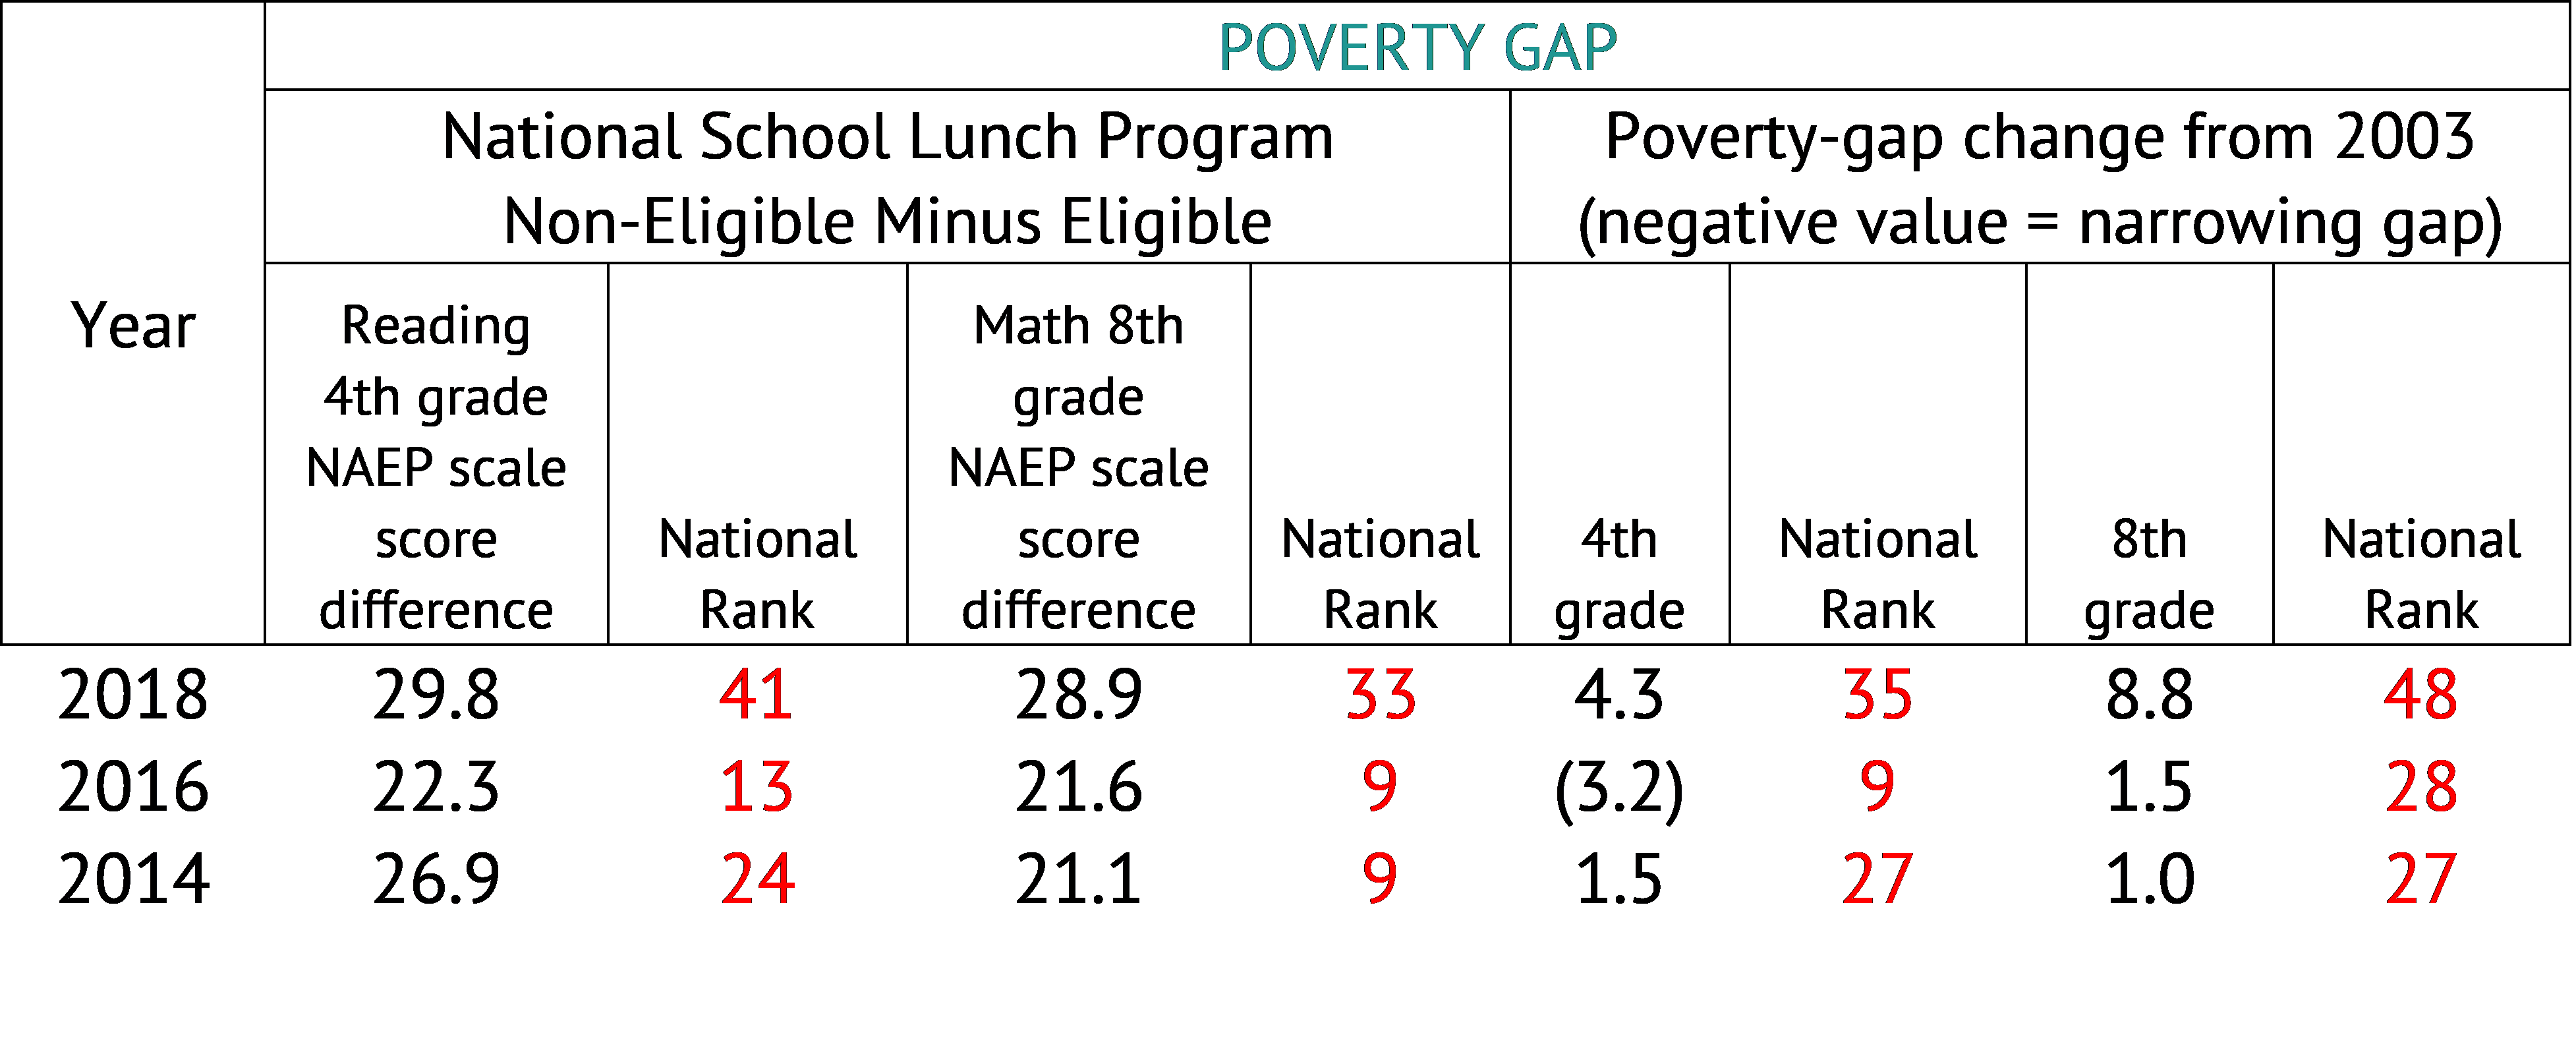
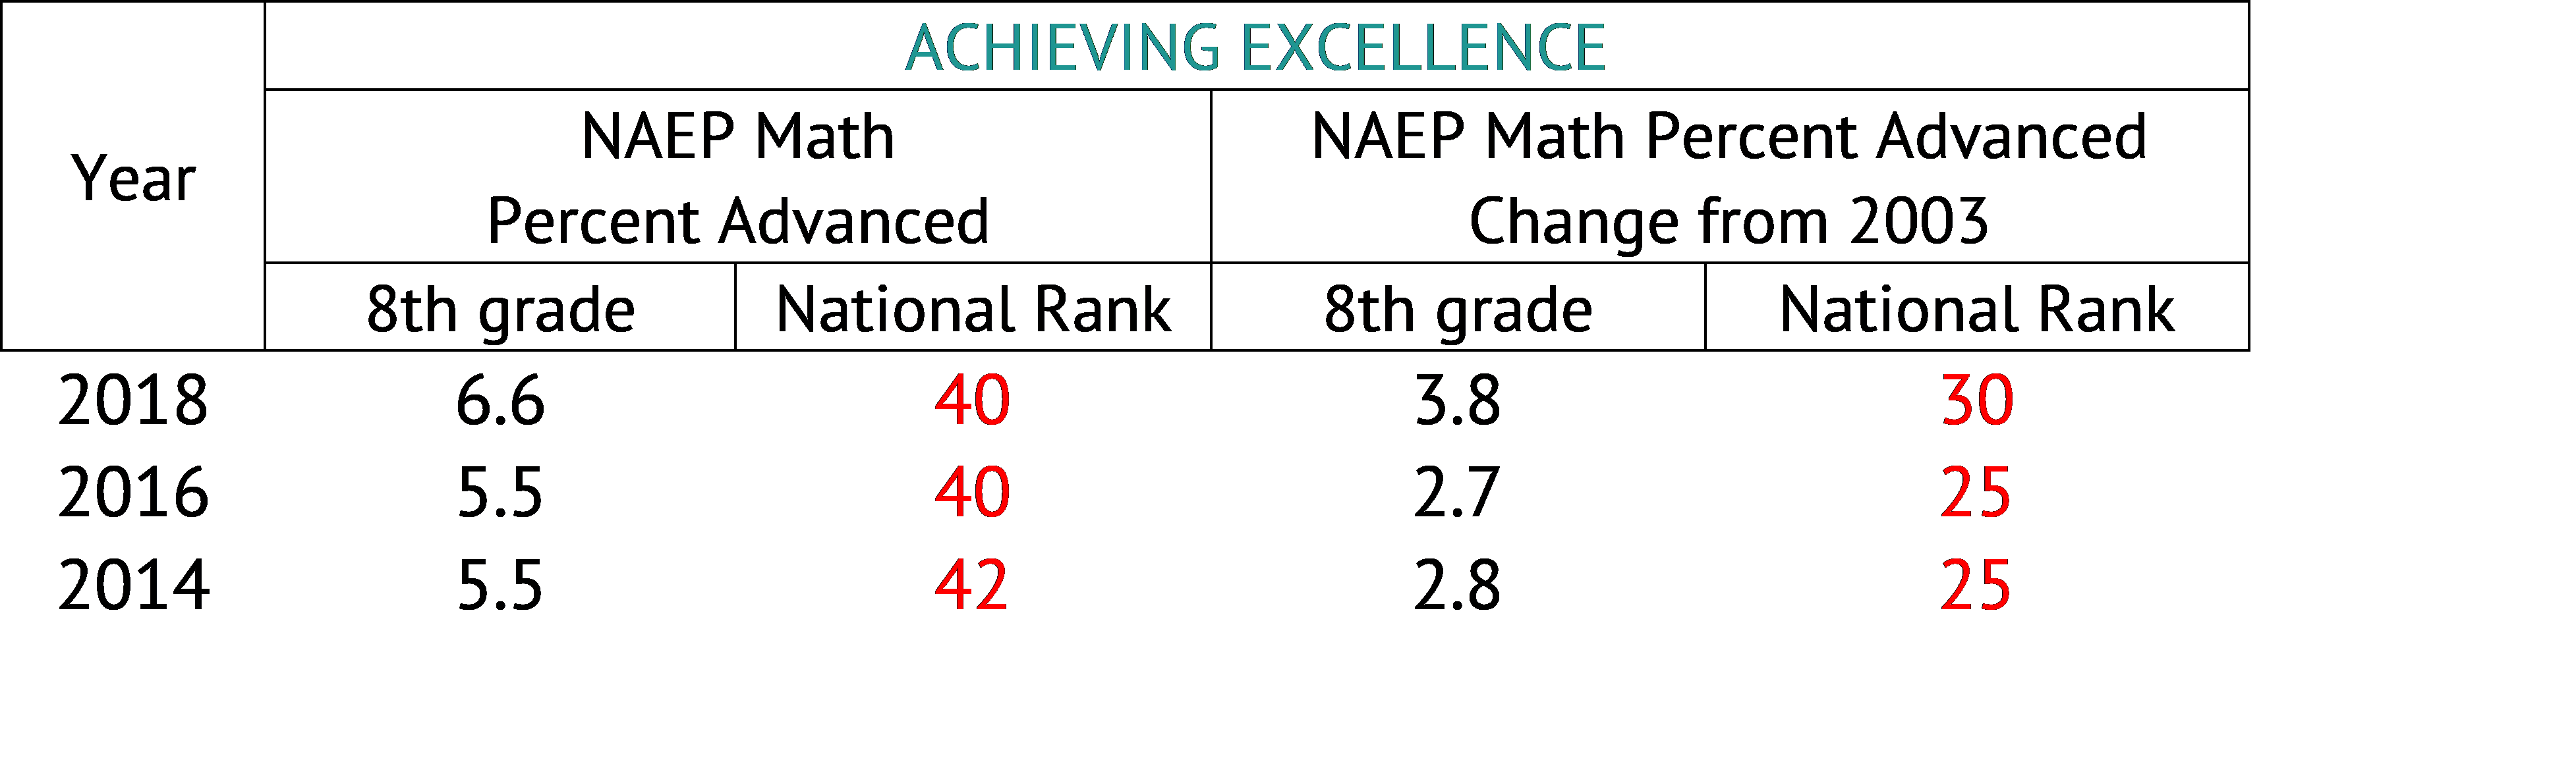
Table 3 displays the percentage of students scoring in the “Advanced” category on the 8th grade NAEP Math Assessment (students on the NAEP receive a scale score, which is then assigned to one of three performance levels: Basic, Proficiency, or Advanced). It also displays the change in percentage since 2003. Positively, Nevada is increasing the number of students scoring Advanced. However, this increase has done little to change the state’s ranking, and the increase does not seem to be keeping pace with the rest of the United States, as Nevada has fallen five spots in the national rankings related to the change since 2003.
Table 3 – Nevada NAEP Results – Students Scoring Advanced on NAEP: 2014 – 2018
Overall, the NAEP data from 2014 to 2018 suggests an overall downward trend in Nevada’s proficiency rates. Math proficiency rates are decreasing in both 4th and 8th grade, and there are mixed results for reading proficiency. The average scale score has declined in 4th and 8th grade math, as well as 8th grade reading; (the only increase in scale score is 4th grade reading). The most positive takeaway is that Nevada ranks in the top 10 in change in reading proficiency since 2003. The Silver State also fares well on the change in math proficiency since 2003.
Graduation Rates
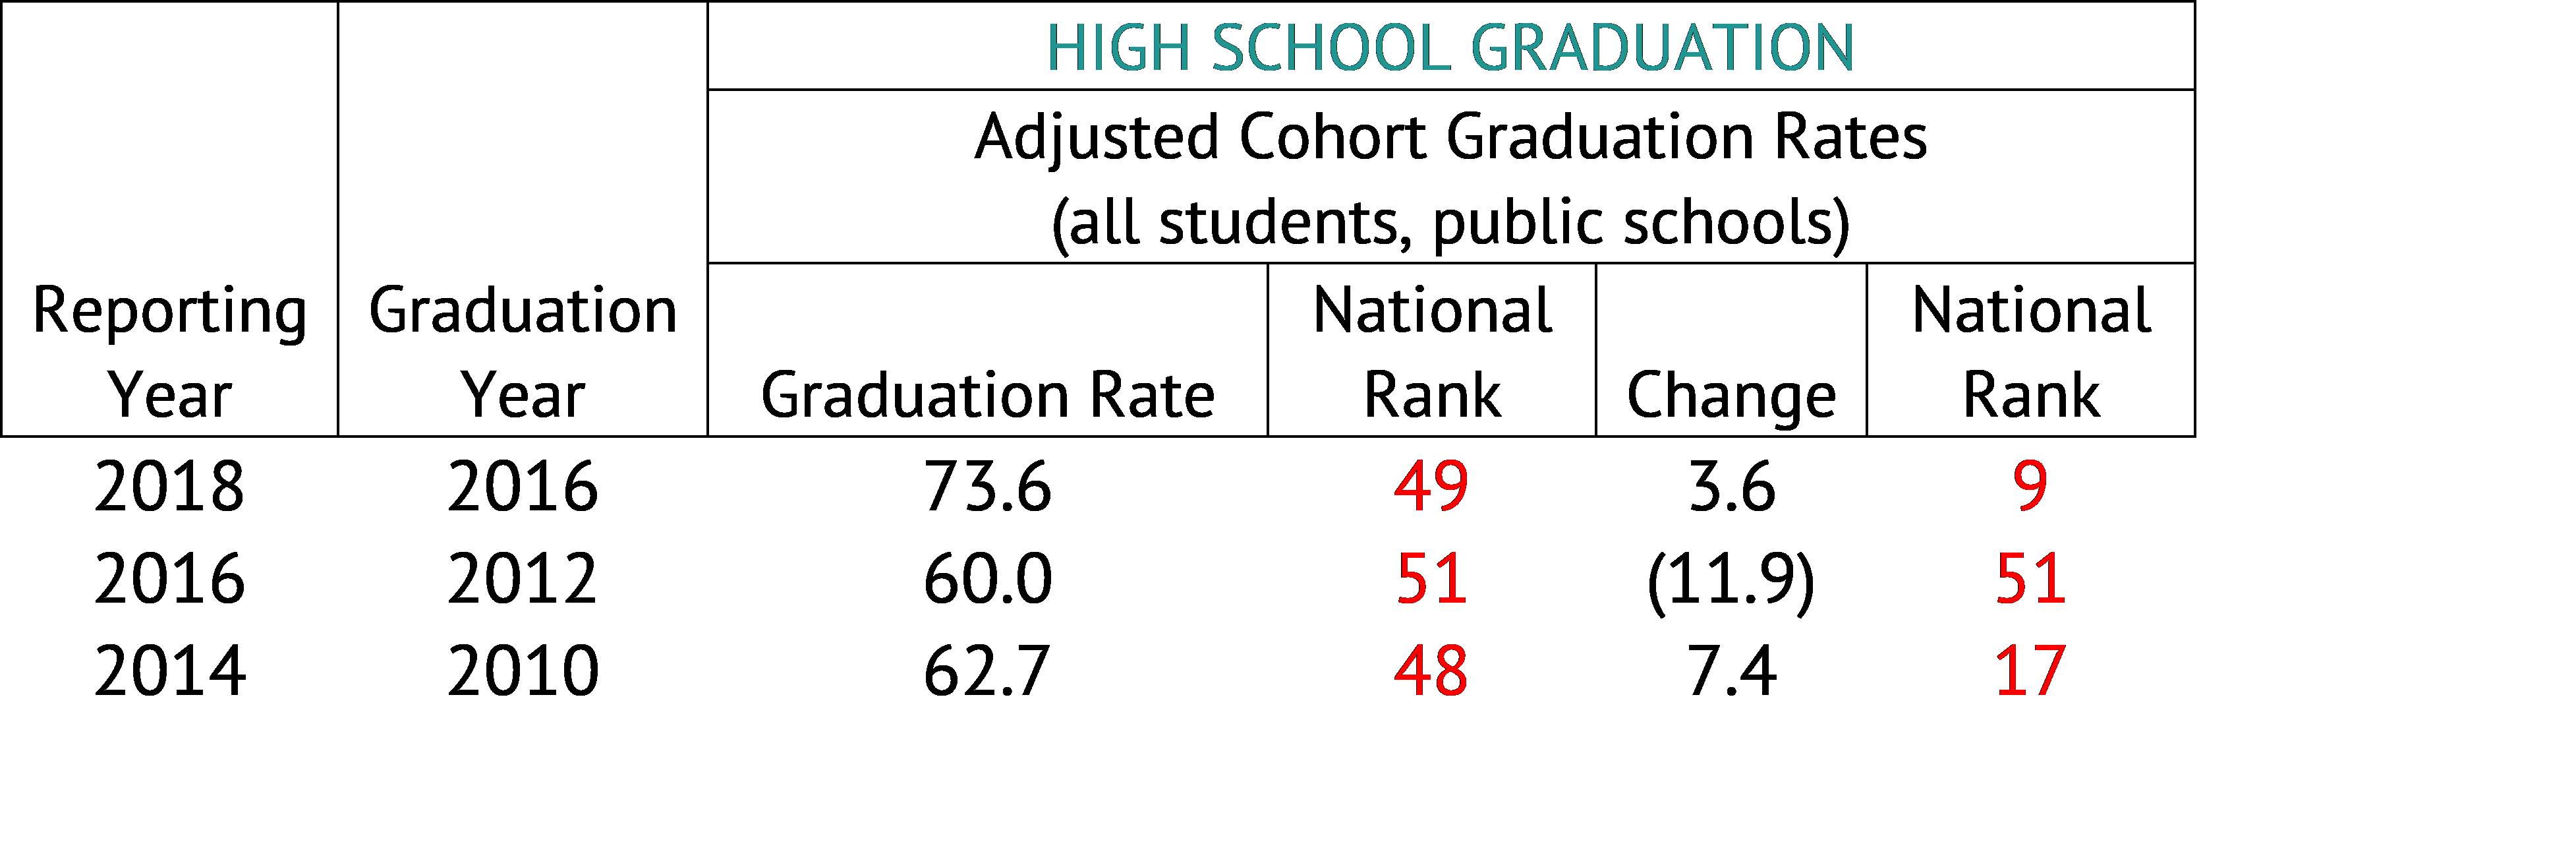
Graduation rates in Nevada, displayed in Table 4, reveal a more positive story (at least in terms of absolute numbers). The “Reporting Year” column represents the year the graduation rate was published and the “Graduation Year” column displays the graduating class the rate is attributed to. Additionally, it is important to note that the change in graduation rate is not presented consistently year-over-year. For example, in the 2018 report, it is the change in graduation rate from 2014 to 2016. In the 2016 report, it is the change in graduation rate from 2002 to 2012. Finally, in the 2014 report, the change represents the difference in graduation rate from 2000 to 2010.
Ignoring the inconsistency in reporting, the graduation rate increased from 2010 to 2016, but Nevada continues to rank near the bottom of all states. Both the rate and the ranking should increase as the graduation rate for the 2016-2017 cohort increased to 80.9 percent.
Table 4 – Graduation Rates in Nevada
Advanced Placement Exams
The final group of variables included in K-12 Achievement in Education Week’s Quality Counts ratings is the percentage of Advanced Placement (AP) exams taken by 11th and 12th grade students with a score of a 3 or better. A student can receive a score of 1 to 5, with the College Board stating a 3 represents the student is “capable of doing the work of an introductory-level course in a particular subject at college.”
Table 5 – Advanced Placement Results in Nevada
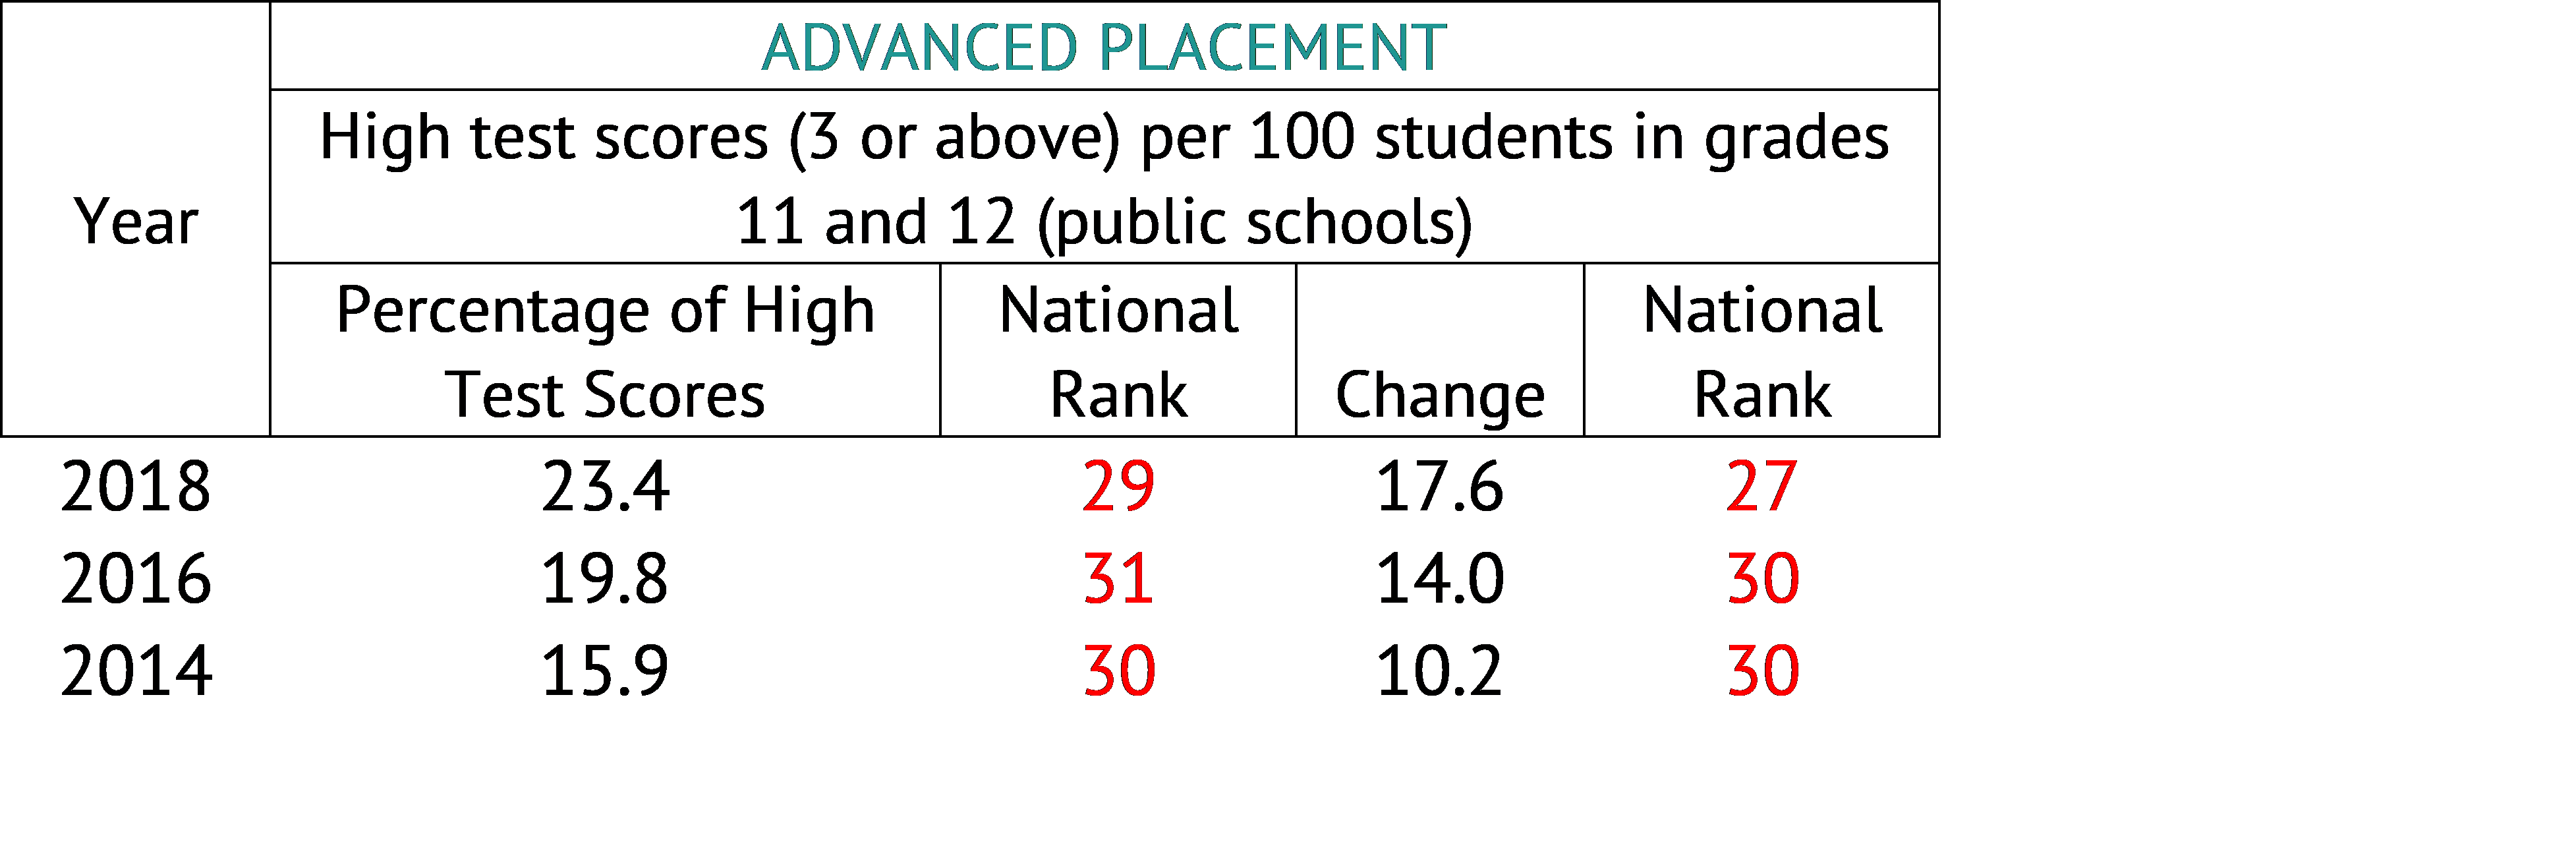
Here again, the data presented in Table 5 displays a positive trend, increasing from 15.9 percent in 2014 to 23.4 percent in 2018. The change column displays the change from 2000 to the reporting year. The results of both the percentage and the change since 2000 place Nevada near the middle of all states.
Conclusion
Overall, the education rankings published by Education Week suggest a number of positive educational outcomes are occurring in Nevada. Graduation rates are increasing, as are the percentage of AP exams taken by 11th and 12th grade students with a score of 3 or better. However, some troubling trends are also presented: proficiency rates and the poverty gap (both measured through 4th and 8th grade NAEP reading and math scores) are trending downward; the single exception is 4th grade reading.
In terms of how Nevada fares compared to the other states, Nevada is near the bottom of the rankings for graduation rates and NAEP results. The graduation ranking will most likely improve as the graduation rate continues to increase. Increasing the NAEP proficiency rate for all students is the challenge for Nevada’s education system. This appears to be the primary lever school districts and the Department of Education can pull to improve Nevada’s educational ranking. However, emphasizing the importance of the NAEP may be challenging primarily because it is only administered every two years to a sampling of students across the state. Even so, Nevada students have performed better on the NAEP over time. The State ranks in the top 10 for the change in NAEP proficiency since 2003 on the 4th and 8th grade reading assessment, as well as ranks 15th in 8th grade change in math proficiency. This finding warrants further study to determine what Nevada has done to increase proficiency rates to be able to then continue to build upon that success.
Unfortunately, Nevada’s overall K-12 Achievement ranking has been moving in an unfavorable direction. Nevada ranked 36th in 2014, 38th in 2016, and 40th in 2018. Education decisions should not be based solely on one data point, and the results from the Quality Counts report is no exception. However, when people reference that Nevada is last in education, most often they are citing this report. As noted previously, this ranking includes several items that are outside of the control of a school district or the Department of Education. However, even with all those caveats, the data are informative and can help provide a more complete understanding of the educational landscape in Nevada.
[1] The use of the NAEP assessment is understandable, but not without problems. All states administer the NAEP, which makes comparison easier. However, a study by the American Institutes for Research found that while there is significant overlap between the NAEP and Common Core standards being taught to students, there is content on the NAEP that is not reflected in the content standards of the grades assessed. This would impact all states, but it is still important to note that there are several questions included on the NAEP covering topics that might not have been taught to students at the time of the assessment.