The Disproportionate Weight CCSD has on State Educational Outcomes Compared to Other Large Districts
By Samuel Lair and Kenneth J. Retzl
An often-cited figure is the vast scope of the Clark County School District (CCSD) as a proportion of Nevada’s total K-12 population. The current Superintendent Jesus Jara, in his State of the Schools address, even noted that “if we fix Clark [County], governor, we fix your state.” This quote suggests that CCSD exerts a significant weight on Nevada’s educational outcomes, and the data suggests that it is hard to argue that claim. CCSD currently oversees the education of 69 percent of all publicly enrolled K-12 students within Nevada. However, without a national context, it is unclear whether Nevada (and by extension, CCSD) is an exception in the national educational landscape. Using data from the National Center for Education Statistics, we provide several figures that help to illustrate how unique CCSD’s relationship with greater Nevada is compared to other states and large school districts. Through this blog, we hope to address the question of whether it is appropriate to compare Nevada’s educational outcomes to other states. Ultimately, we find that CCSD and its educational outcomes influence Nevada’s outcomes much more so than the largest districts in most other states.
Largest Districts in Each State as a Percentage of Total Enrollment
As previously noted, CCSD oversees the education of 69 percent of all publicly educated students in Nevada. To see how CCSD and Nevada compare to other states, Figure 1 arranges each state by the proportion of its largest school district to the state’s total public-school enrollment. As shown below, Hawaii has the largest school district as a percentage of total state enrollment. This is because the Hawaii Department of Education oversees the administration of the entire K-12 education system (i.e. the state is the school district). Nevada ranks second in terms of the proportion of the enrollment of the largest school district to the state’s total enrollment. The District of Columbia Public Schools (which is unique in its own way due to its small geographic size) ranks third, comprising 56 percent of total public education enrollment. Only three other states (Alaska, New York, and New Mexico) have a single school district that constitutes at least 25 percent of total state enrollment.
Figure 1: Largest District’s in Each State as a Percentage of Total Public-School Enrollment
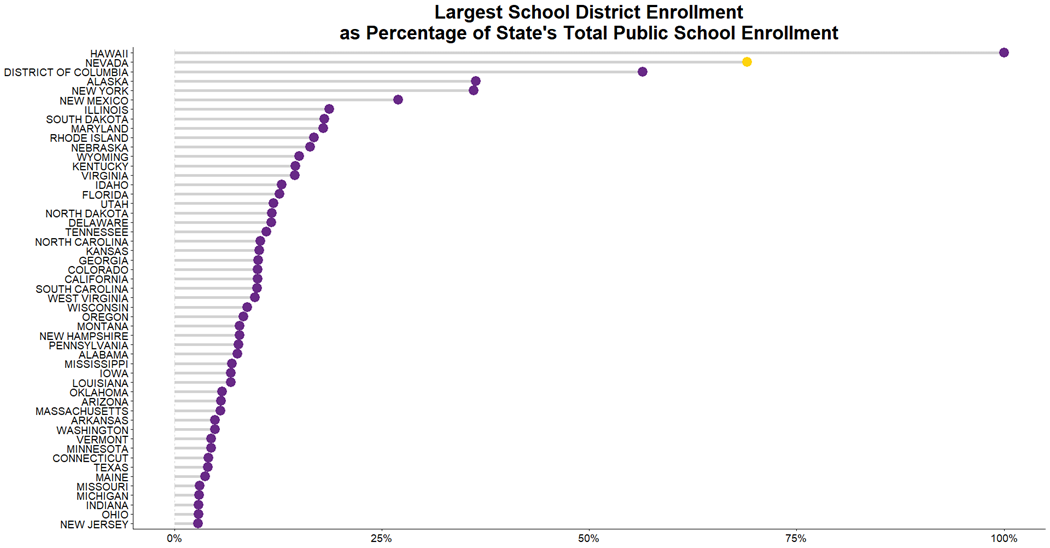
Largest School Districts as a Percentage of Total Enrollment
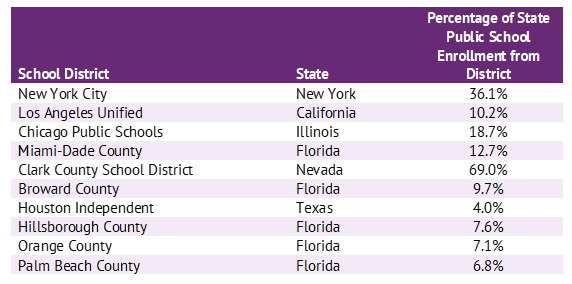
While Nevada ranks second when measuring the largest school district as a percentage of total enrollment, it is also interesting to examine the largest school districts in the United States to determine how large they are compared to total state enrollment. Table 1 lists the ten largest districts in the United States and presents the percentage of state public school enrollment that is represented in that district. Once again, comparing these districts to CCSD (regarding the proportion of the respective state totals) another stark contrast emerges. Of these ten districts, only New York City makes up more than 20 percent of its total state enrollment, and five of the ten districts make up less than ten percent of their state totals.
Table 1: Ten Largest Districts and the Percentage of the State’s Public-School Enrollment in that District
Implication for State Comparisons
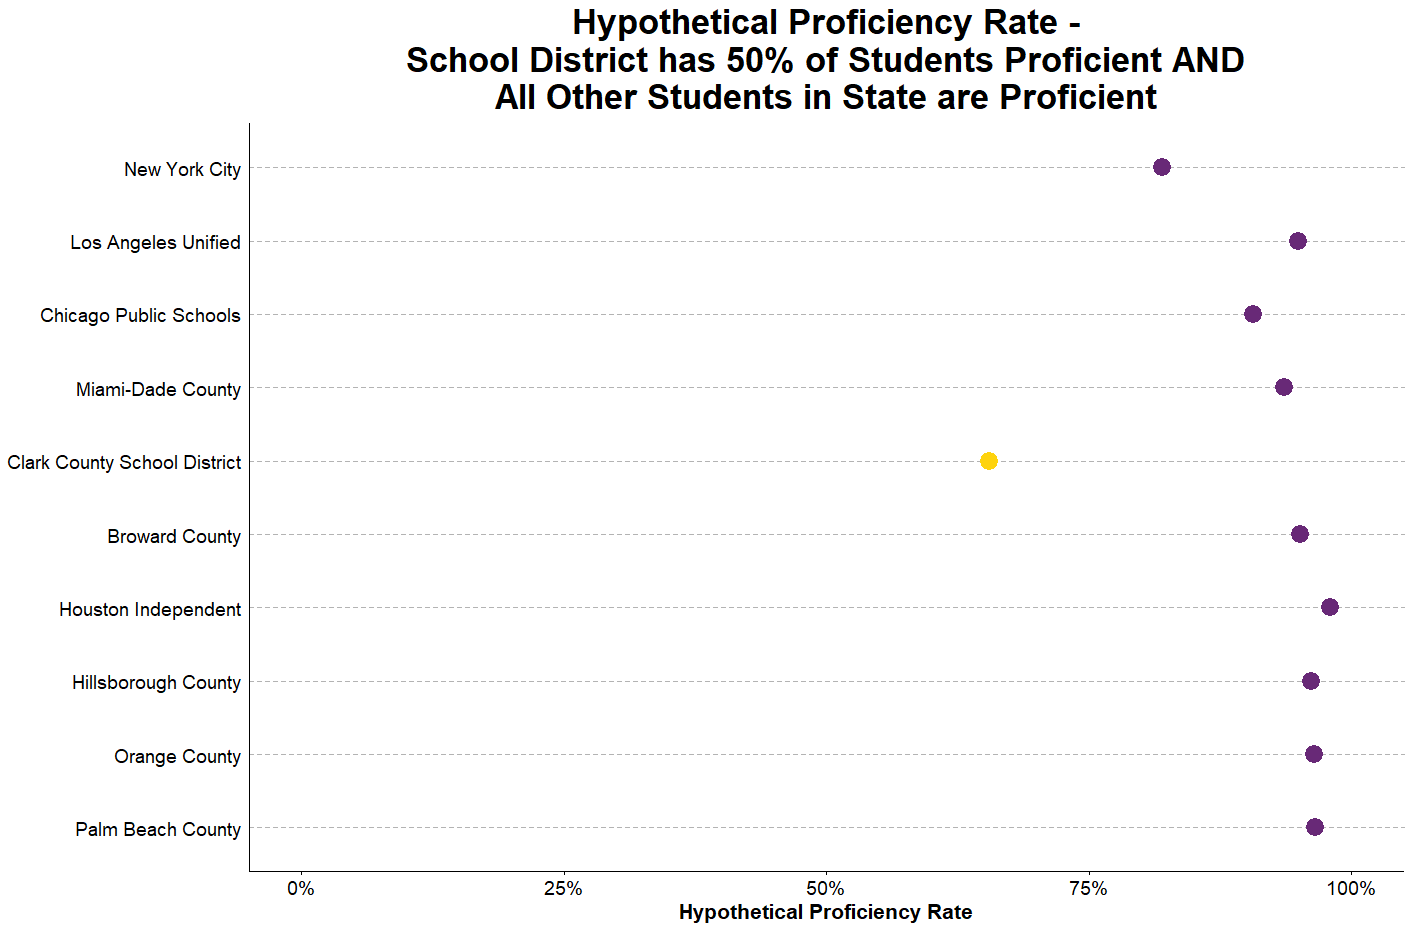
To demonstrate the importance of the extraordinary weight of CCSD on Nevada’s educational outcomes, we have calculated a hypothetical proficiency rate for the ten largest districts, assuming:
- Fifty percent of students in the district were deemed proficient, and
- All other students in the state, but outside of the district in question, were proficient (e.g. a 100 percent proficiency rate).
In this scenario, we can better recognize the effect each district has on the greater state given a single metric and how that district can drastically skew the portrait of an entire state. The results of this calculation are represented below in Figure 2. As shown, CCSD has the most drastic effect on its home state, dropping the state proficiency rate to approximately 65 percent:
State proficiency rate = (69 percent of Nevada students in CCSD x 50 percent proficiency rate) + (31 percent of Nevada students outside CCSD x 100 percent proficiency rate) = 65.5%
This contrasts with the other states, where a majority of the student population is disseminated across many districts in the state rather than concentrated within a single district. Thus, all other districts exert a significantly lower weight on their home states’ overall performance.
Figure 2: Hypothetical Proficiency Rate – School District has 50% of Students Proficient and All Other Students in State are Proficient
Conclusion
Overall, when comparing Nevada’s educational outcomes to other states, it is important to consider the disproportionate impact that CCSD has on the entirety of Nevada’s K-12 public education system compared to the largest districts in other states. As shown above, no other state, except for the Hawaii Department of Education, makes up a larger share of its total student population than CCSD. Furthermore, as shown by our hypothetical proficiency rates, no other school district has as major of an influence on overall state proficiency ratings as CCSD does on Nevada. Therefore, this places Nevada into a unique circumstance regarding its K-12 education system. When comparing Nevada educational outcomes to other states, one is, in effect, comparing a large, urban district (CCSD) to entire states’ outcomes.